
Designing Your Data Collection Instrument
Adding a New Field
Field Types
…….…..Overview
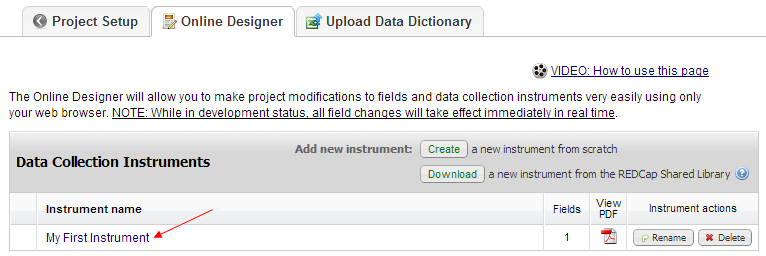
The Online Designer is a tool to design data instruments. When starting an empty project (no template), your first instrument will be called “My First Instrument.” Rename this instrument by clicking the “Rename” button on the right. To begin editing, click on the instrument name.
By default, the first instrument will have only one field titled “Record ID.” This field is a unique record/participant identifier, and must be preserved. Change the name of the field by clicking the Edit icon (the yellow pencil). Whatever you decide to call it (“Participant ID,” “Study ID,” etc.), its purpose as a unique identifier must remain the same. This field does not need to be repeated for any other data instruments throughout the project; this is the only place you will need to identify it as a field and it will automatically be piped in at the top of all other instruments.
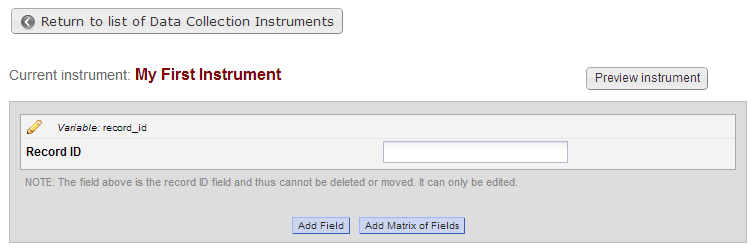
Click the “Preview Instrument” button to preview what your instrument will look like during actual data entry. Calculated fields and branching logic will not work in this preview but will work when test records are entered.
…….…..Adding a new field
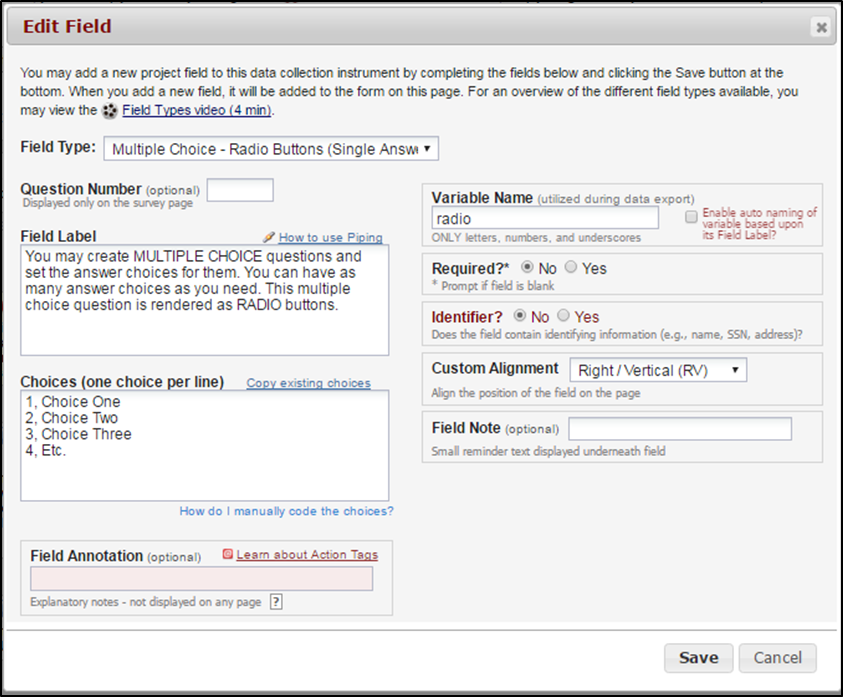
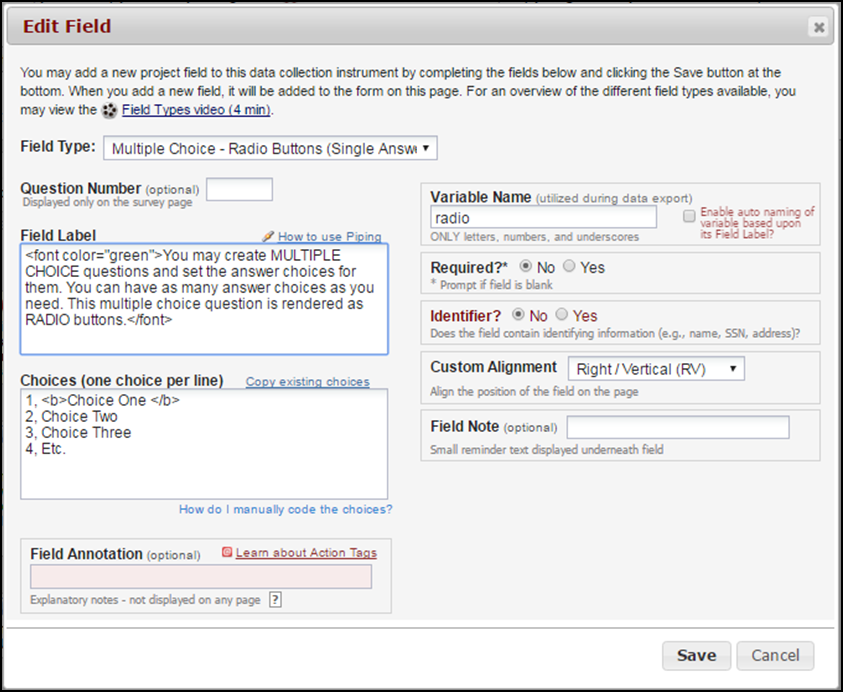
To create a new data field, click the “Add Field” button. There are twelve types of fields to choose from. The example in this section will use the “Text Box” field type (essentially a “short answer” field), one of the most common field types in REDCap data entry. The general “new field” addition process is very similar across field types – however, other types may have additional features or nuances associated with them, which is discussed in detail in the Field Types section.
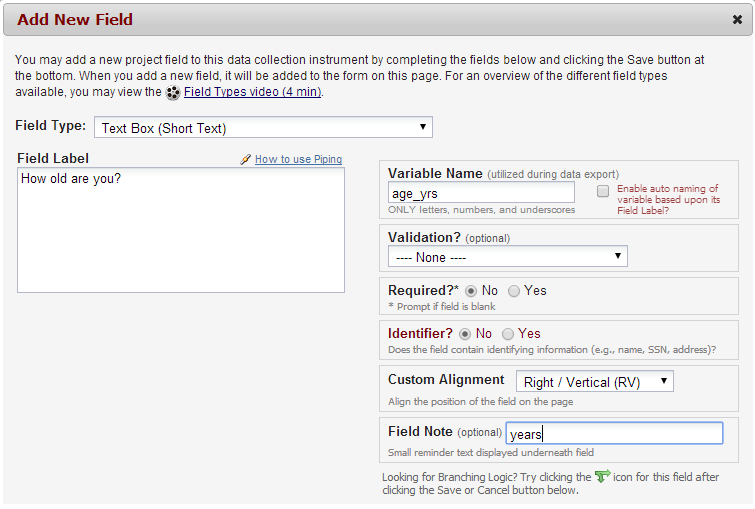
If you are designing a survey, the Field Label will generally be a question, such as “How old are you?” If you are designing a research data entry form, your Field Label may look more like a standard label, such as “Baseline heart rate:”.
The Variable Name is used by REDCap to store the data. We strongly advise against enabling auto-naming for variables (the check-box to the right of the Variable Name field). You generally want to keep variable names short but somewhat descriptive, so that if you need to export your data, you will be able to recognize key variables. For instance, “Q1” is not a very descriptive variable name, and is not advised for most situations. “Height” is a good variable name, but “height_in” or “height_cm” is even better, because you are reiterating your measurement unit within the variable name, which is good practice.
Validation (which is optional) is discussed in detail in the Data validation section.
The Required option, by default, is set to “no.” If changed to “yes,” it will require an answer before a data form can be saved (or before a survey can be submitted, depending on your study set-up). If you require a field that triggers under certain branching logic, an answer is required only if the field is displayed. If the field stays hidden, an answer will not be required.
The Identifier option should be marked whenever a field asks for one of the 18 HIPAA identifiers. When you export or view de-identified data, the fields that were marked as identifiers will be omitted. A concise list of the 18 HIPAA identifiers is listed below, but for an official list and supporting details, see Box 2 on this page from the CDC website: http://www.cdc.gov/mmwr/preview/mmwrhtml/m2e411a1.htm
A brief reminder of the 18 HIPAA identifiers: 1.) names, 2.) geography more specific than state, 3.) any relevant dates more specific than year, 4.) phone numbers, 5.) fax numbers, 6.) e-mail addresses, 7.) SSNs, 8.) MRNs, 9.) health plan beneficiary numbers, 10.) account numbers, 11.) certificate/license numbers, 12.) vehicle identifiers, 13.) device identifiers, 14.) URLs, 15.) IP addresses, 16.) biometric identifiers, 17.) full-face photographic images, and 18.) any other unique identifying number, code, or characteristic.
The Custom Alignment option changes how the question (and answers, if the field is a multiple choice option) appears in the data entry screen. We don’t recommend adjusting this unless there is an aesthetic need to do so, but play around with the functionality as you explore REDCap’s features.
The Field Note option displays a side-note in small text beneath the text entry field (or multiple choice options) on the data entry screen. It is useful for designating units or clarifying how a question should be answered (e.g. “Mark all that apply”).
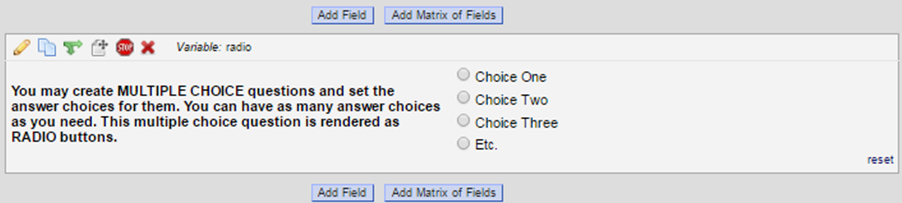
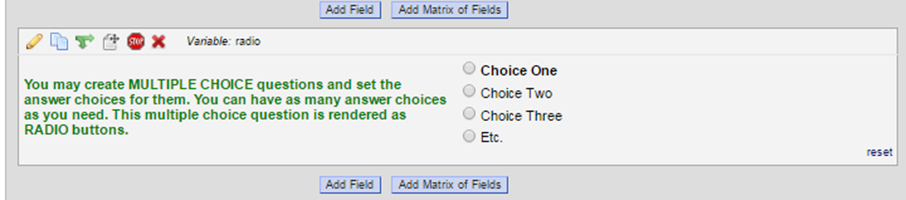
The end result of the field creation in this example looks like this:

The Choices component of field creation is specifically for multiple choice field types (drop-down list, radio buttons, and check-boxes). It appears directly below the Field Label and serves as the place to list the various choices to select from, one choice per line. REDCap automatically “codes” these variables in increasing order beginning with “1.” This is for data storage purposes, and will not affect the way the choices are viewed in data entry. Below is the screen that will be prompted if you have not provided manual codes for your choices:
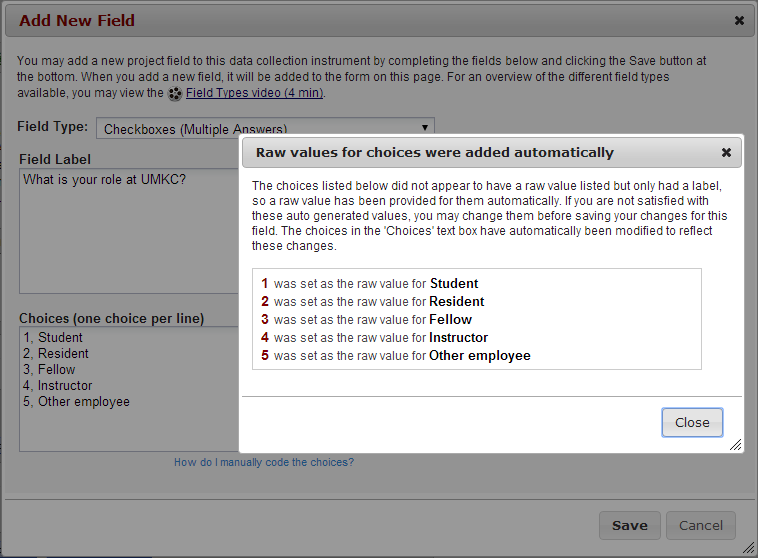
[TIPS AND TRICKS]:
Generally, it is acceptable to have REDCap provide the automated coded values for your multiple choice options, but there may be instances in which you should manually enter or change the coded values. For instance, for choices “Never,” “Once per month or less,” “Two to five times per month,” and “More than once a week” there is an absolute zero and “Never” should be coded as 0 (rather than 1) and the scale moves up from there (0, 1, 2, 3).
If you have many forms, it can be helpful to add a prefix to your field variable names that indicates which form they are on. For instance, a variable representing age in years on your Demographics form might be labeled “dm_age_yrs.”
We strongly advise against numbering your fields within the field label (e.g. “1. How old are you?”). Any branching logic or future decisions to move/delete fields will drop or mix numbers, causing unnecessary work later. The REDCap survey option features auto-numbering and custom numbering abilities, which should be used instead (toward the end of project design).
…….…..Field types
There are twelve types of fields you may choose from: Text Box, Notes Box, Calculated Field, Multiple Choice – Drop-down List, Multiple Choice – Radio Buttons, Check-boxes, Yes-No, True-False, Slider, File Upload, Descriptive Text, and Begin New Section.
1.) Text Box: a single-line text box for text and numbers. The example in the Adding a new field section is a text box.

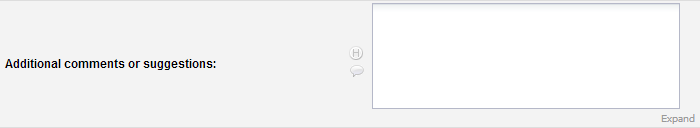
2.) Notes Box: a large text box for a large amount of text. This is convenient for long descriptions and “Additional Comments” boxes.
3.) Calculated Field: a field which performs real-time calculations based on the entries in other fields. The syntax for complicated calculations can be intricate, but REDCap will alert you to any syntax errors, and will refuse to attempt calculations until they are resolved, preventing data errors. Variable names are referred to in [brackets] in the written calculation equation.
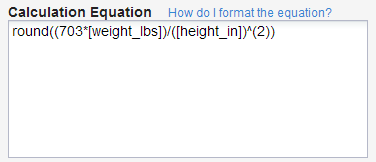
In this example, weight_lbs and height_in are two variables from previous questions used to calculate Body Mass Index (BMI). Clicking the “How do I format the equation?” hyperlink will open a dialog box describing some of the nuances and specifications of the calculation syntax, such as the rounding function used in this example.
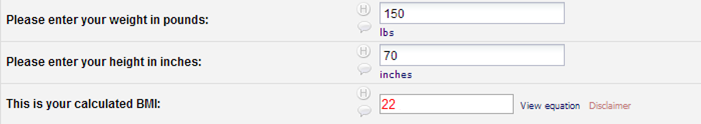
In data entry, it is impossible to directly edit the value of a calculated field (hence the red text). This ensures the integrity of the calculation procedure.
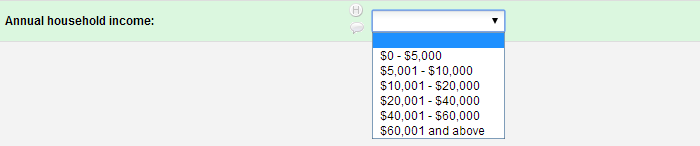
4.) Multiple Choice – Drop-down List: a drop-down menu with options. Only one option can be selected. This can help save space on a data form if there are many different choices to display.
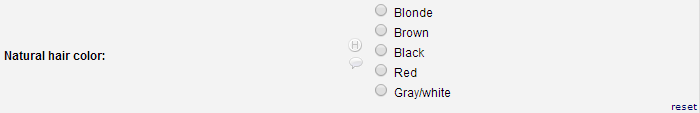
5.) Multiple Choice – Radio Buttons: a set of radio buttons (round buttons) where only one choice can be selected at a time. The “reset” button in the corner removes any current selection and returns the field to a null (absent) value.
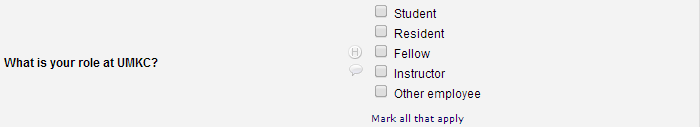
6.) Check-boxes: check-boxes which allow the selection of multiple answers.
7.) Yes-No: radio buttons with the options “Yes” and “No.” These values are automatically coded: “Yes” = 1, “No” = 0.

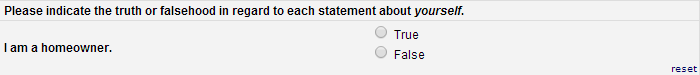
8.) True-False: radio buttons with the options “True” and “False.” These values are automatically coded: “True” = 1, “False” = 0.
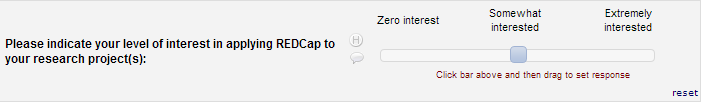
9.) Slider: visual analogue scale coded as values 0-100. You may provide labels above the left/bottm, middle, and right/top sides of the slider.
10.) File Upload: an uploading tool for images or documents that can be attached to individual records (e.g., Informed Consent forms, lab reports, etc.)

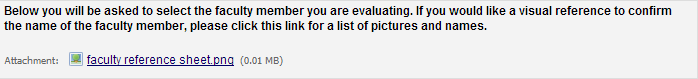
11.) Descriptive Text: text displayed with optional image/file attachment. The file may be displayed as a clickable (downloadable) link, or (if the file is an image) displayed in-line with the text.
12.) Begin New Section: a field composed of a single line appearing in different color from the rest of your form, indicating separation. This is largely for aesthetic/organizational purposes. Adding text (to serve as a header) is optional. When deploying a survey, you have the option to break each section into separate pages, giving these headers a true separation functionality.
[TIPS AND TRICKS]: In your data entry screens (not including the survey submission screen), there is a small “H” and speech bubble appearing beside each field. The “H” tracks the history of all recorded data values for that particular variable. The speech bubble is the Field Comment Log, which allows users to make comments on particular fields, and lights up when a comment exists for a field.
In the Text Box field type, you can use Validation to ensure that data entered is the type of data you expect for that field. By utilizing this feature, REDCap will prompt an error when a field’s entry does not meet certain expectations for data type. There are eleven basic data types that you can designate via the Validation option: date (3 formats), datetime (6 formats), e-mail, integer, letters only, number (5 formats), phone number (North America format of 10 digits), Social Security Number (U.S.), time (2 formats), and ZIP code (U.S.).
1.) Date: The three different formats you can specify for date are Day-Month-Year, Month-Day-Year, and Year-Month-Day. A small calendar icon will be visible next to the field in data entry to easily pick the date. You can also click the “Today” icon to automatically fill in the current date.
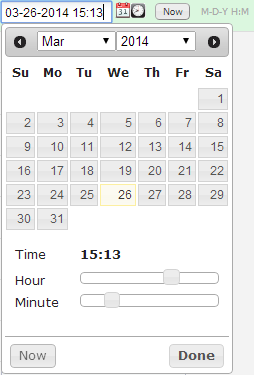
2.) Datetime: Datetime can be recorded with or without a “seconds” count. The three without seconds follow the same formats as the three Date formats (listed above), with an additional H:M to indicate time (Hours:Minutes). The three that do include seconds also follow the same three Date formats, with an additional H:M:S to indicate time (Hours:Minutes:Seconds). Like the Date option, a calendar icon appears next to the field, as well as a clock icon. You can also click the “Now” icon to automatically fill in the current date and time. An example of the calendar/clock dialog box:
3.) E-mail: To validate an e-mail address entry, REDCap checks for a singular “@” symbol and an appropriate e-mail domain ending (such as “.com” or “.edu”). The inclusion of other special characters that would not be a part of valid e-mail addresses (such as “$” or “#”) will also prompt a data validation error. If you are expecting e-mail addresses connected to new or uncommon domains, we do not recommend using this validation option.
4.) Integer: Integers include all of the negative and positive whole numbers, plus zero. Any decimal or fractional values will prompt a validation error, as well as any values outside the designated minimum-maximum range.
5.) Letters only: This validation type will only accept English alphabetical characters. It will not accept spaces, numbers, special characters, or accented letters. It should not be used for names as they might have spaces (e.g, Mary Ann or Van Wagner) special characters (e.g., O’Malley or Taylor-Johnson), or accented letters (e.g., René or Pérez).
6.) MRN: This validation type will only accept ten numerical digits, no longer and no shorter. No other non-numerical character is allowed.
7.) Number: This validation type accepts numbers, including decimal values. The five formats are derived from the number of decimal points you choose to allot: 1, 2, 3, 4, or unspecified. If you choose to specify a number of decimal points, an error will be prompted if that exact number of decimal points is not met. For instance, if you have specified two decimal points, an entry of “3” or “3.0” would not be accepted – only “3.00” is considered a valid entry in this case.
8.) Phone: This validation type will only accept a ten-digit North American phone number. Not including a valid 3-digit area code will prompt an error. It is fairly lenient regarding the input format (spaces, no spaces, hyphens, etc.), but it will change your entry to a standardized “(###) ###-####” format upon field completion.
9.) Social Security Number: This validation type will only accept nine numeric digits separated by hyphens in the appropriate U.S. SSN format. Example: 123-45-6789.
10.) Time: This validation type accepts only HH:MM time format. Like the Datetime type, the clock icon and/or the “Now” icon can be used to assist data entry.
11.) ZIP code: Only five- or nine-digit ZIP codes are accepted. Nine-digit ZIP codes must include a hyphen separating the first five from the final four, or an error will be prompted.
[TIPS AND TRICKS]: Many of the data validation types include an option for setting minimum and maximum expected values. We strongly encourage users to employ this wherever applicable. For instance, if a field asks for the age of a participant, you may want to set the minimums and maximums around your study eligibility guidelines, such as 16 to 55. If you do not have study eligibility rules, it is still a good practice to set relatively reasonable limits, such as 4 to 120. An alert will show if a value falls outside the minimum and maximum range, but you will not be forced to change the number.
For certain questions to appear only under certain conditions, use branching logic. Let’s say in your Online Designer you have the following two questions:
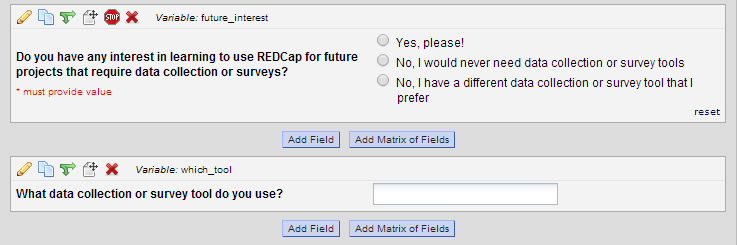
You only want the second question to appear if the participant selects “No, I have a different data collection or survey tool that I prefer” to the first question. Because the appearance of the second question (the variable “which_tool”) is dependent on the answer to the first question (the variable “future_interest”), we call future_interest the parent (or independent) question and which_tool the child (or dependent) question.
To begin defining your branching logic, click the branching logic icon (the green arrows) on the child question. The Branching Logic dialog box will appear. You may use either the Advanced Branching Logic Syntax box or the Drag-N-Drop Logic Builder box. For most branching logic uses, the Drag-N-Drop Logic Builder will be sufficient. The Advanced Syntax is for people who have experience with programming syntax.
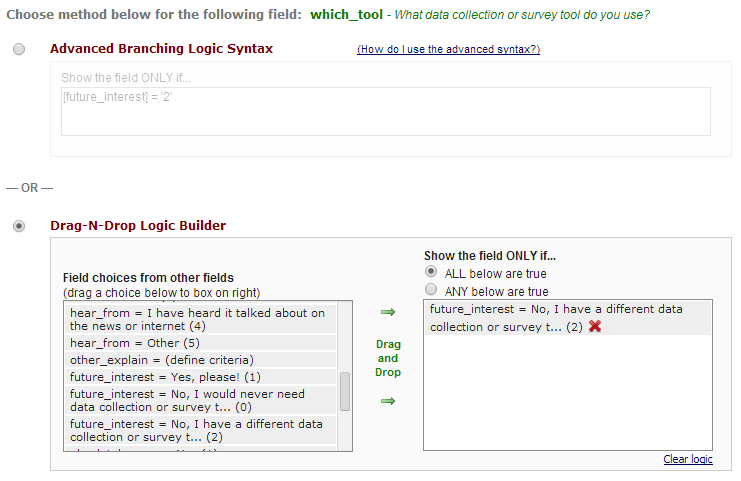
Simply drag and drop the appropriate conditions, being sure to specify whether you want ANY or ALL of the conditions to be true in order for the child question to appear.
Remember, branching logic is only employed on the child question. Since we want our first question to remain static regardless of any other values on the page, leave it alone.
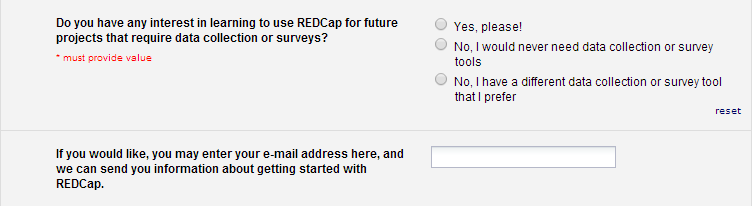
Implementation:
Survey appearance before choosing any option (or with a non-target option selected):
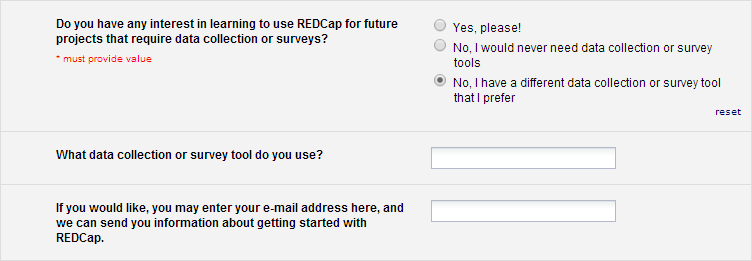
Survey appearance after choosing the logic-dependent option:
[TIPS AND TRICKS]:
Be sure to thoroughly test any use of branching logic with practice records to ensure that your fields/questions are being displayed exactly as you want them. Recall that the “Preview Instrument” function in the Online Designer will not test branching logic; only actual practice records can do this.
Try not to include too many conditions in your branching logic. Overuse of branching logic can lead to a higher chance of errors.
If an entire instrument is dependent on branching logic, consider using the Survey Queue instead.
Setting up a Matrix of Fields is essentially writing many questions at once that all use the same set of answers (such as a likert scale). For this reason there is only one section to define column/answer choices, but there are many field labels, each with their own variable names and requirement statuses. You may add as many rows/questions as necessary for your matrix.
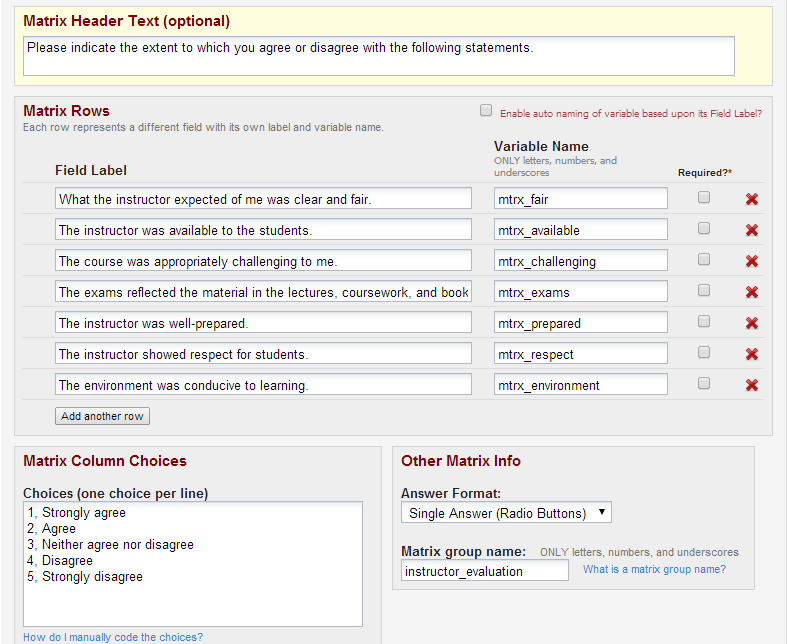
There are two answer formats for matrices of fields: Single Answer (Radio Buttons) and Multiple Answers (Check-boxes).
A matrix group name must be provided. Its naming mechanism is similar to the general variable naming mechanism. The group name itself is a coded value which ensures that no matter what display platform the matrix goes through, all of the rows will be displayed together in a single matrix.
[TIPS AND TRICKS]: When exporting data, it will be easier for your data manager to keep track of matrix fields by assigning each field’s variable name the same short prefix, such as “mtrx_” or “eval_”.
For large or repetitive projects, you may need to make large-scale changes to your forms that would be tedious to perform with the Online Designer. The Data Dictionary is a CSV file version of your project, and serves as an efficient way to make large-scale changes using (usually) Excel.
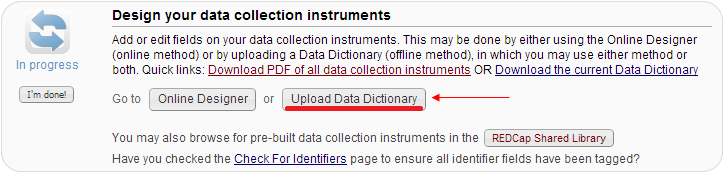
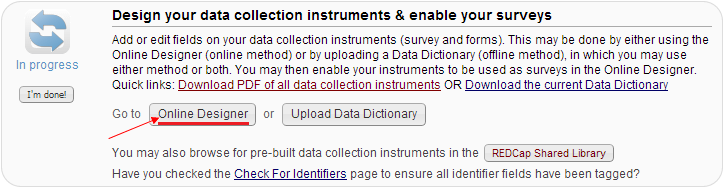
To begin making changes to your project using the Data Dictionary, click “Upload Data Dictionary” on the home page of your Project Setup. It will prompt you to download the current Data Dictionary so that you can make changes to it. Here is a sample excerpt from a Data Dictionary (with the columns expanded for readability):
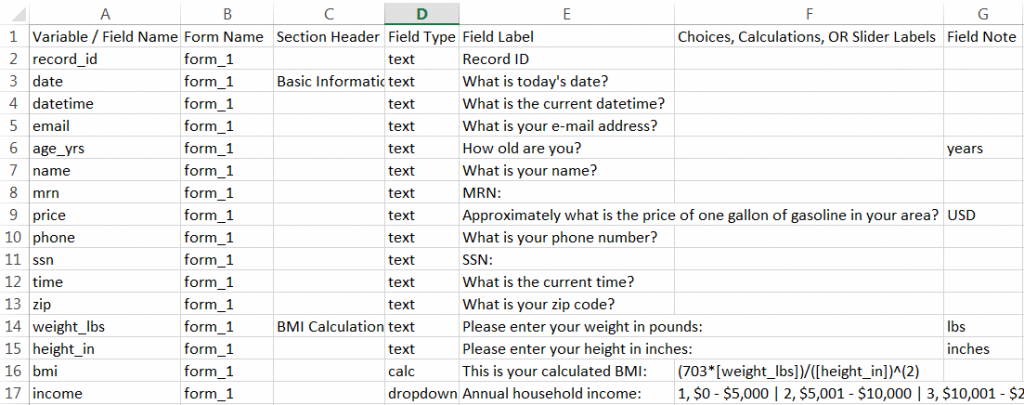
Large-scale changes made easier through the Data Dictionary include copying fields (rows) into another form. For example, if you want to copy rows 3 through 13 into form_2, highlight rows 3 through 13 in Excel (the entire rows), copy, paste into the appropriate position (ensuring you did not paste over any other rows), and change the Form Name (column B) to “form_2” for the newly pasted rows.
To upload the modified Data Dictionary, save the CSV file and upload it using the Upload Data Dictionary window. Error messages will show if there are syntax errors. If there are no errors, REDCap will ask for confirmation to completely replace the old Data Dictionary (not append to it).
[TIPS AND TRICKS]:
Remember, the Data Dictionary does NOT contain any of the information from any of your practice records. Changing information in the Data Dictionary can sometimes affect information in the records (deleting fields, for instance), but it will not erase the records or corrupt the data.
If you are making large-scale changes using the Data Dictionary, it may be helpful to save separate copies of your old Data Dictionary in case you discover any errors later on after uploading it (for instance, if you mistakenly deleted several fields that you did not intend to delete).
The Shared Library can be accessed from the home page of your Project Setup.
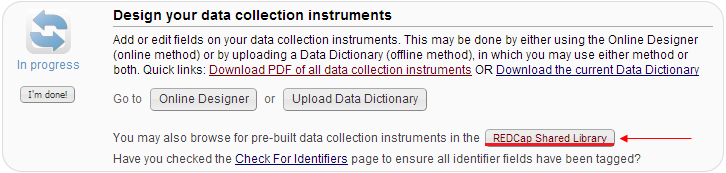
In the Shared Library, browse and search through a collection of data entry forms that have been uploaded by other users. You may view forms as a web page or PDF and decide whether to incorporate it into your project as a new data form. Some require you to agree to a “Terms of Use,” which simply requests that you do not claim any of their forms as original works (which is easy to follow given you don’t delete the descriptive text within the form that gives details about intellectual property). Not all forms will ask this.
[TIPS AND TRICKS]: If you don’t find the results you want from your first search, be sure to search for synonymous and/or related keywords. For instance, if you search “education” and don’t find any relevant results, try “academic” or “school.”
Projects that use a longitudinal design may track records over a series of multiple events. Different data collection forms can be associated with different events; in addition, the same form can be utilized over multiple events. For instance, a Demographics form may only need to be completed at the very first event, while a Lab Results form may be required at each event.
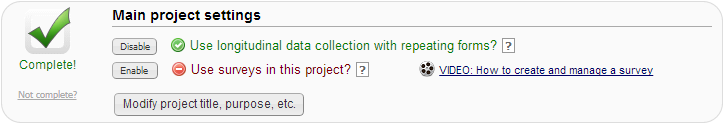
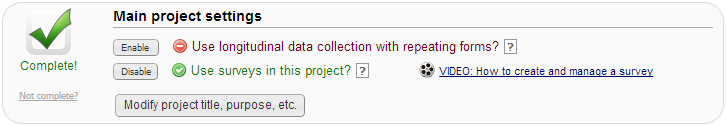
In order to utilize the longitudinal study features of REDCap, enable the use of longitudinal data collection in your “Main project settings” options on your Project Setup home page.
Once you have enabled the use of longitudinal data collection, a new module will appear in your main Project Setup page to define your events.
When defining your events, be sure to title each event and specify the “Days Offset” from the initial event. You first event’s “Days Offset” should be 0.
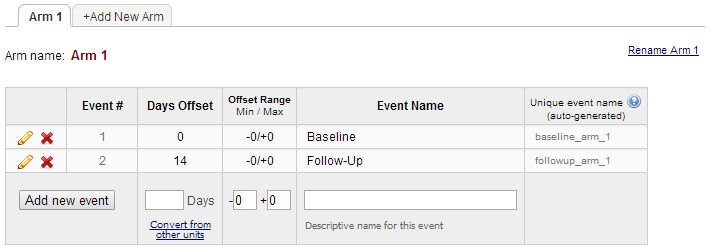
This page is also where you define your study’s Arms. If you have multiple treatment groups or multiple sample populations, you may want to utilize this feature. Arms can be custom-named, and do not necessarily need to have the same forms/events as other Arms. This can allow you to easily group/block records. A single record may not belong to more than one Arm.
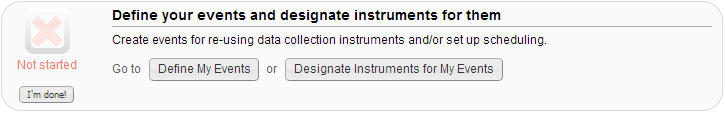
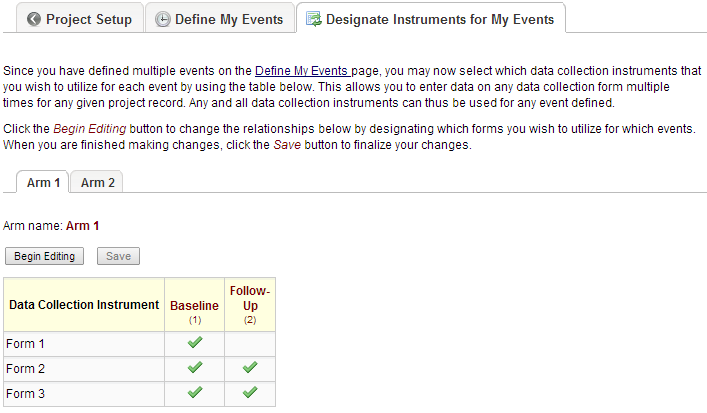
Once you have defined your events (and Arms, if applicable), designate forms for your events. Click the “Designate Instruments for My Events” tab and “Begin Editing” to assign forms to your defined events. In a longitudinal design, each form must be attached to at least one event.
[TIPS AND TRICKS]: See the Calendar/Scheduling section for information on how to automatically add scheduled Events to the Calendar module.
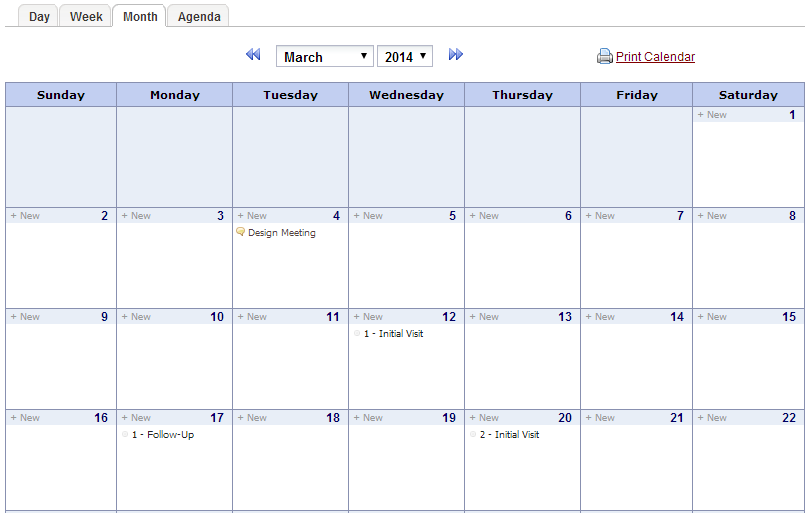
The calendar feature of REDCap allows you to keep track of events related to your project/study, with the option of associating each event with a record/subject. In the above example, three of the events are attached to specific records, while the Design Meeting is not. Various viewing modes are available for the calendar and you may also print the calendar.
Another feature of the Calendar module is the Scheduling module, which is available for longitudinal studies only. The Scheduling module can be seen by enabling both the “Use longitudinal data collection with repeating forms?” option and the “Scheduling module (longitudinal only)” option.
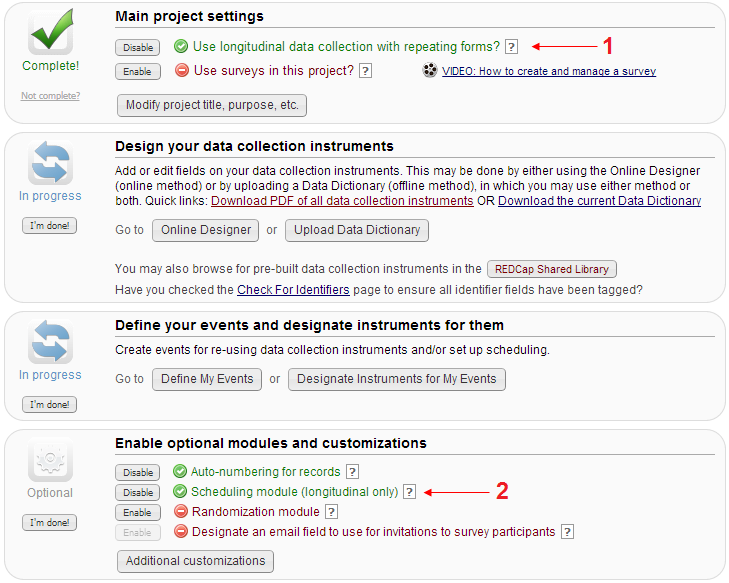
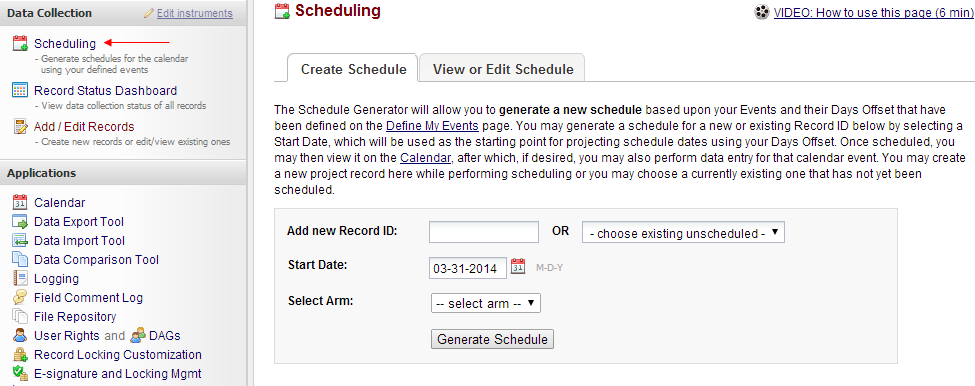
Once both of those options are enabled, a new “Scheduling” tool will appear in the left-side menu. Assuming that you have already set up your Events with the correct “days offset” specifications (see the Longitudinal studies section), adding new Record IDs will automatically generate a schedule to add to the calendar with all events accordingly booked for that record. You may also generate a schedule for the remaining events on any existing record.
Randomization is a process that assigns participants/subjects by chance (rather than by choice) into specific groups, typically for clinical research and clinical trials.
Click here for more information on the Randomization module.You can use HTML to customize the Field Label and Choices sections of each variable/field.
Here is a field without HTML:
Online Designer
Displays as
Here is the same field, but with the color green added for font color on the Field Label and the first Choice field bolded:
Online Designer
Displays as
HTML formatting will display for both online Data Entry and Surveys. Additional survey customization is available under Survey Settings.
An important part of any project is the testing phase. REDCap allows you to create practice records to test the full functionality of your forms (surveys or traditional data entry). Testing is especially important for branching logic, calculated fields, and survey appearance (if applicable). For more information about practice records for surveys, see the Survey-based studies section.
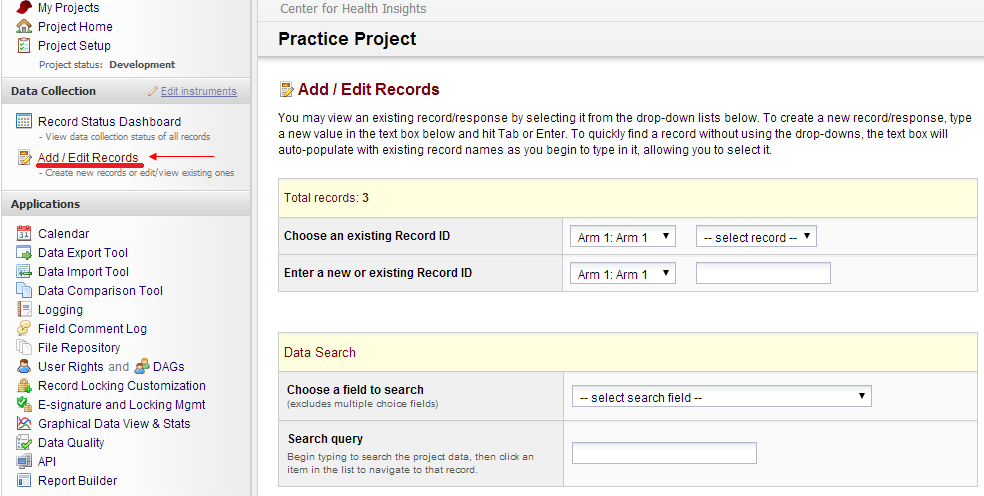
To create a test record: once you are in the main “Add/Edit Records” page, choose an existing record to edit, create a new record by typing in or adding a new Record ID, or search for a particular record by a field value (for instance, using the search field “Name” and typing “Jane Doe” into the search query). If you are employing multiple Arms in your study, the first two options sort the records into groups by Arm. If you don’t know which Arm to search, use the Data Search option.
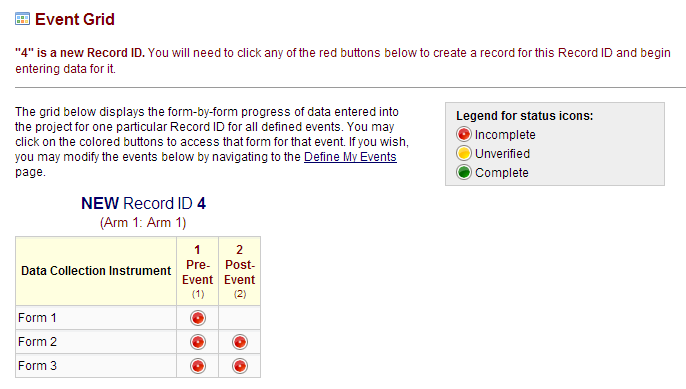
If your study is not employing multiple Events (e.g., it is not a longitudinal study), your first data entry form will appear immediately, ready for data input. If your study does employ multiple Events, you will see a screen similar to the one above. Records are edited one Event at a time; clicking on the first form of an Event and filling it out will lead you through the forms assigned to that specific Event and then return you to this screen. To learn more about longitudinal studies and Events, see the Longitudinal studies section.
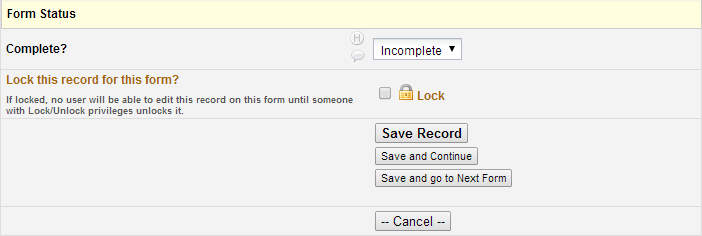
At the bottom of your data entry form, you have the option to mark the form as Incomplete, Unverified, or Complete. Incomplete forms will display a red icon, the yellow icon indicates Unverified, and green indicates Complete.
Clicking “Save and Continue” will save your progress and keep you on the current page. Clicking “Save and go to Next Form” will save all data and take you immediately to the next form for that record. Clicking “Save Record” will save all data and return you to the “Add/Edit Records” main page. You may also lock forms for a record to prevent other users from editing existing information.
The most important thing to remember about practice records is that they are intended for practice. This means that no real data should ever be entered into REDCap while your study is still in Development mode. Real data entry will occur once you move your project into Production mode, where your forms are finalized and data is more securely protected.
[TIPS AND TRICKS]: In data entry mode (not survey), there is a small “H” and speech bubble appearing beside each field. The “H” tracks the history of all recorded data values for that particular variable. The speech bubble is the Field Comment Log, which allows users to make comments on particular fields, and lights up when a comment exists for a field.
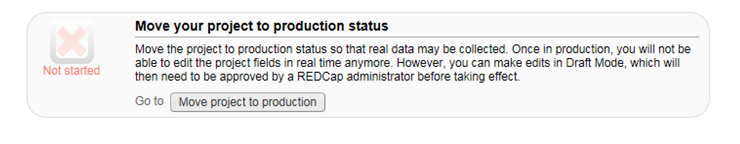
Once your project has been created and tested adequately, you may move to Production mode and begin collecting real data. Click the “Move project to production” button at the bottom of Project Setup
You’ll get a NOTICE that asks you to verify that you’ve thoroughly tested your project and that you understand future changes may require the approval of a REDCap Administrator.
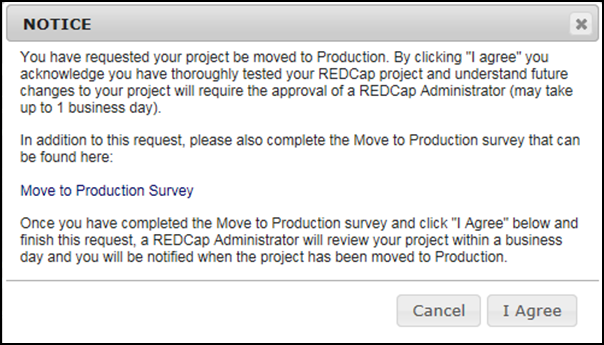
You will also be asked to fill out a move to Production Survey that can be found here.
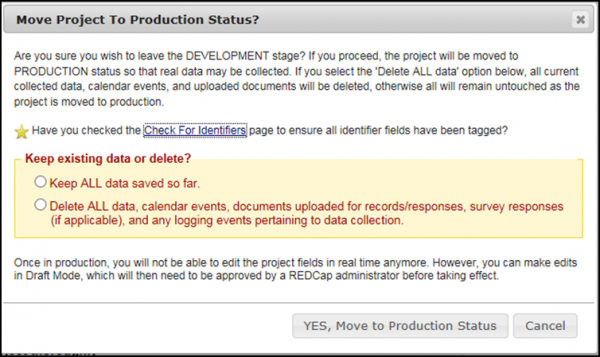
After you click "I agree" you will get one more prompt that asks that you’ve checked for identifiers and if you want to KEEP or DELETE all the data you’ve submitted so far (practice records, calendar events, and all other associated practice data).
For Research projects, your IRB must be in approved status.
For Clinical projects, the EMR Governance Committee must approve your project in REDCap before it can move to production and real clinical data can be entered. The EMR Governance Committee meets every two weeks and you must first officially request your project be moved to production and also fill out the Move to Production survey before your project will be reviewed at the next committee meeting. For this reason, it may take 2-4 weeks for a clinical project to be moved to production.
For Operational, Quality Improvement or Other projects, there is no official oversight, but we encourage you to have your project reviewed by appropriate groups or persons.
Once your project is approved for Production, you will receive an e-mail alerting you to its new status. Your project is now ready for real data to be collected.
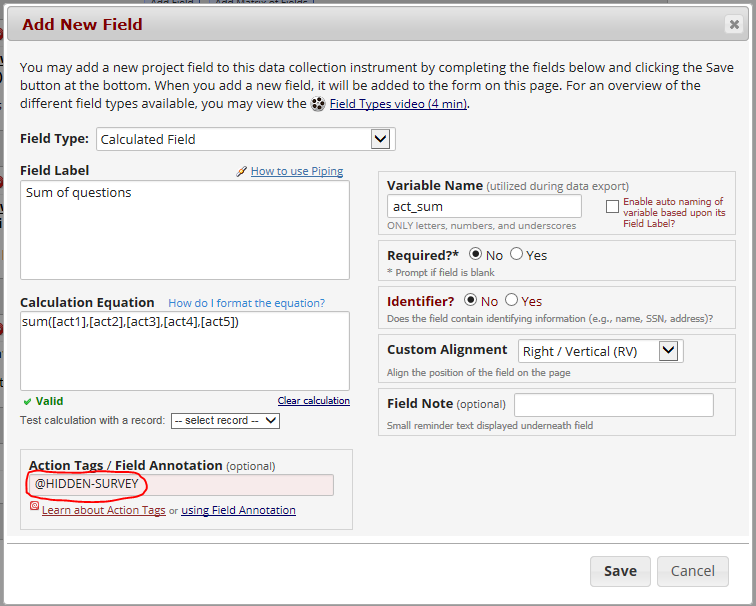
Action Tags are special terms that begin with the '@' sign that can be placed inside a field's Field Annotation. Each action tag has a corresponding action that is performed for the field. Actions include hiding or disabling a given field (either on a survey, data entry form, or both). Multiple action tags can be used within a field and should be separated with a space.
An example of an action tag is @HIDDEN-SURVEY. When you put @HIDDEN-SURVEY in a field's Field Annotation text box, the field will always stay hidden when viewed on a survey page but will be visible when viewing the same instrument as a data entry form. This might be helpful if you want to hide specific fields from your survey participants so that they do not see them. In the example below, the field that calculates the sum of questions is hidden on the survey so the participant will not see it.
The table below lists available action tags.
|
@CHARLIMIT |
Sets the maximum number of characters that can be enetered into a Text field or Notes field, and displays the number of characters remaining. |
|
@DEFAULT |
Sets a field's initial value. This allows a field to have a specified default value when viewing the field on a survey or data entry form that has not yet had any data saved for it (i.e., when the form status icon is gray or when a survey page has not had any data entered yet). The format must follow the pattern @DEFAULT="????", in which the desired default value should be inside single or double quotes. For checkbox fields, simply separate multiple checkbox values with commas - e.g., @DEFAULT='1,3,6'. For example, if checkbox fields have the following choices: 1, Tylenol and you always want Tylenol and Ibuprofen to be auto-chosen, then the set your action tag as @DEFAULT = ‘1,3’ For text fields, you may perform Piping inside the default value to pipe data from another field in the project - e.g., @DEFAULT='Name: [first_name] [last_name], DOB: [dob]'. When piping within @DEFAULT, the values being piped from ([first_name] [last_name] [dob]) must be captured and saved on a form that comes before the @DEFAULT field. Some tips about @DEFAULT:
|
|
@HIDDEN |
Hides the field on the survey page and the data entry form. Field will stay hidden even if branching logic attempts to make it visible. |
|
@HIDDEN-FORM |
Hides the field only on the data entry form (i.e., not on the survey page). Field will stay hidden even if branching logic attempts to make it visible. |
|
@HIDDEN-SURVEY |
Hides the field only on the survey page (i.e., not on the data entry form). Field will stay hidden even if branching logic attempts to make it visible. |
|
@HIDEBUTTON |
Hides the 'Now' or 'Today' button that is typically displayed to the right of date, time, and date/time fields. |
|
@HIDECHOICE |
Hides one or more choices of a multiple choice field. The action tag is useful if you wish to 'retire' a particular choice and hide it without losing data. Works with following field types: Checkbox, Radio, Drop-down, Yes-No, and True-False. |
|
@LATITUDE |
Allows a Text field to capture the latitude of the user, in which the user will be prompted on the webpage to allow or deny this. Once the value is captured, it will not be changed when visiting the page at a later time. The field will be disabled and will not allow users to edit the value, but it will allow them to remove the value altogether. NOTE: While the GPS value will be very accurate when captured on a mobile device, it will not be nearly as accurate when using a browser on laptops and desktop computers. |
|
@LONGITUDE |
Allows a Text field to capture the longitude of the user, in which the user will be prompted on the webpage to allow or deny this. Once the value is captured, it will not be changed when visiting the page at a later time. The field will be disabled and will not allow users to edit the value, but it will allow them to remove the value altogether. NOTE: While the GPS value will be very accurate when captured on a mobile device, it will not be nearly as accurate when using a browser on laptops and desktop computers. |
|
@MAXCHECKED |
Allows a checkbox field to have a maximum number of checkboxes (answers) that can be checked. |
|
@MAXCHOICE |
Limits the number of times one or more specified answer choices can be selected/saved. After specified amount of records have been saved with that choice, the answer will be disabled (displayed but not usable). Works with the following field types: Checkbox, Drop-down, and Radio. |
|
@NONEOFTHEABOVE |
Allows for the designation of a checkbox choice to be a 'none of the above' option, and it will ensure that no other choices are checked if that one choice is selected. |
|
@NOW |
Automatically provides the user's current time as the value of a Text when the page is loaded. Once the value is captured, it will not be changed when visiting the page at a later time. If the field has validation, the value will conform to the date/time format of the field. The field will be disabled and will not allow users to edit the value. NOTE: The time will be the user's local time, which is derived from their device/computer. Also, this action tag should not be used with fields that will be hidden by branching logic because it will always prompt the user to erase the value when the field gets hidden. |
|
@PASSWORDMASK |
Masks the value of a Text field so that the true value is not visible on the webpage after it has been entered (like password fields on login pages). |
|
@PLACEHOLDER |
Is used to specify a short hint that describes the expected value of a Text field or Notes field (e.g., a sample value or a short description of the expected format). The placeholder is displayed inside the field before a value is entered. The format must follow the pattern @PLACEHOLDER='????', in which the text to be displayed should be inside single or double quotes. |
|
@RANDOMORDER |
Randomizes the order of answers on survey and data entry fields. The order will always be different each time the page is loaded. Works for following field types: Checkbox, Radio, Drop-down, Yes-No, and True-False. |
|
@READONLY |
Makes the field read-only (i.e., disabled) on the survey page and the data entry form so that its value cannot be changed. |
|
@READONLY-FORM |
Makes the field read-only (i.e., disabled) only on the data entry form (i.e., not on the survey page) so that its value cannot be changed. |
|
@READONLY-SURVEY |
Makes the field read-only (i.e., disabled) only on the survey page (i.e., not on the data entry form) so that its value cannot be changed. |
|
@TODAY |
Automatically provides the user's current date as the value of a Text when the page is loaded. Once the value is captured, it will not be changed when visiting the page at a later time. If the field has validation, the value will conform to the date/time format of the field. The field will be disabled and will not allow users to edit the value. NOTE: The date will be the user's current date, which is derived from their device/computer. Also, this action tag should not be used with fields that will be hidden by branching logic because it will always prompt the user to erase the value when the field gets hidden. |
|
@USERNAME |
Sets a field's value to the username of the current REDCap user. If this is used on a survey, the value will be '[survey respondent]'. Once the value is captured, it will not be changed when visiting the page at a later time. |
|
@WORDLIMIT |
Sets the maximum number of words that can be entered into a Text field or Notes field, and also displays the number of words remaining. |
Please note—you must attend a Shazam class in order to use it in your REDCap projects. If you’d like to attend a class, please contact the REDCap Administrator at REDCap@NJHealth.org.
This is Example 1 of a survey using regular REDCap:
And this is Example 1 of a survey, with the same fields, using Shazam:
This is Example 2 of Shazam used with a radio field, date field, and comment field:
See step-by-step instructions of setting up Shazam here.
Download an HTML Shazam template of Example 1 here.
Download an HTML Shazam template of Example 2 here.
Surveys
To utilize the survey features of REDCap, enable “Use surveys in this project” under Main projects settings on your Project Setup home page.
Once enabled, a new module in your left-side menu will appear: “Manage Survey Participants.” The first time you enter this module you’ll be prompted to enable at least one of your existing data collection forms as a survey. There are many customizable survey settings that you will be prompted to confirm, but you can edit them later by clicking the “Survey settings” option next to the form on the front page of your Online Designer.
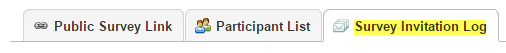
After a form has been enabled as a survey, the Manage Survey Participants module will show three tabs: Public Survey Link, Participant List, and Survey Invitation Log.
The Public Survey Link is a singular URL to your survey that does not track IP addresses, e-mail addresses, or any other identifying information. New records that are created by survey submissions appear in your existing records in auto-numbered order and are labeled only by the date/time of submission.
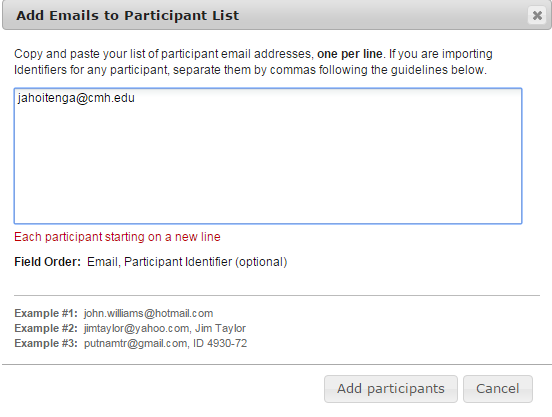
The Participant List tab will enable you to send out a group of e-mails to participants from REDCap. Each e-mail will contain a unique URL that is only valid for one submission. To add the e-mail addresses of your participants to the participant list, click “Add participants” and type in the e-mail addresses, one per line. This will only create your list of participant e-mail addresses; no e-mails have been sent out by the completion of this step. Creating a list allows you to send the surveys out in batches rather than all at one time. To actually begin sending out the survey e-mails, click the “Compose Survey Invitations” button.
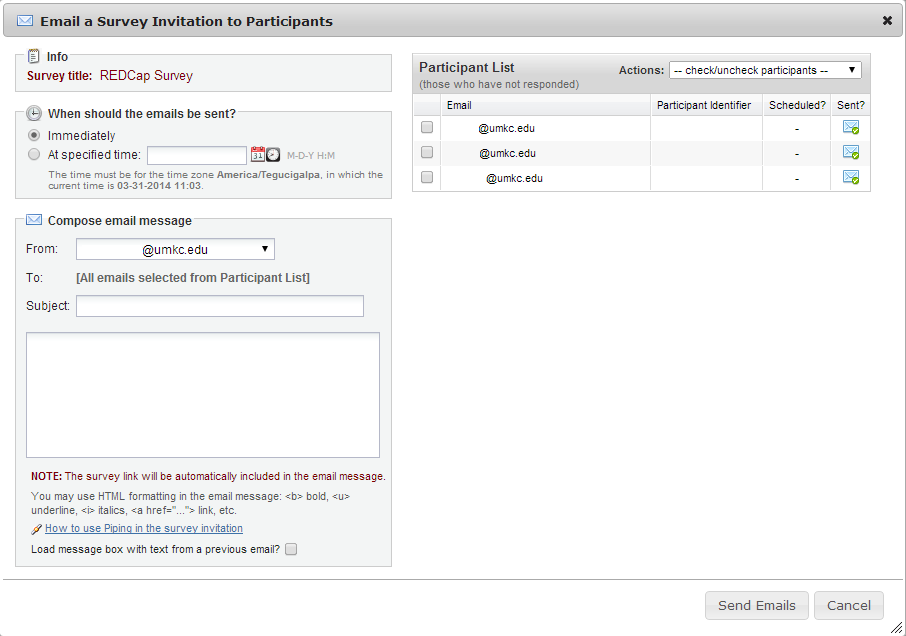
You may designate the time at which the e-mails are sent out, if reminders are sent, the subject of the e-mail, any additional content or comments of the e-mail invitation, and the checklist of participants to whom you would like to send the e-mail.
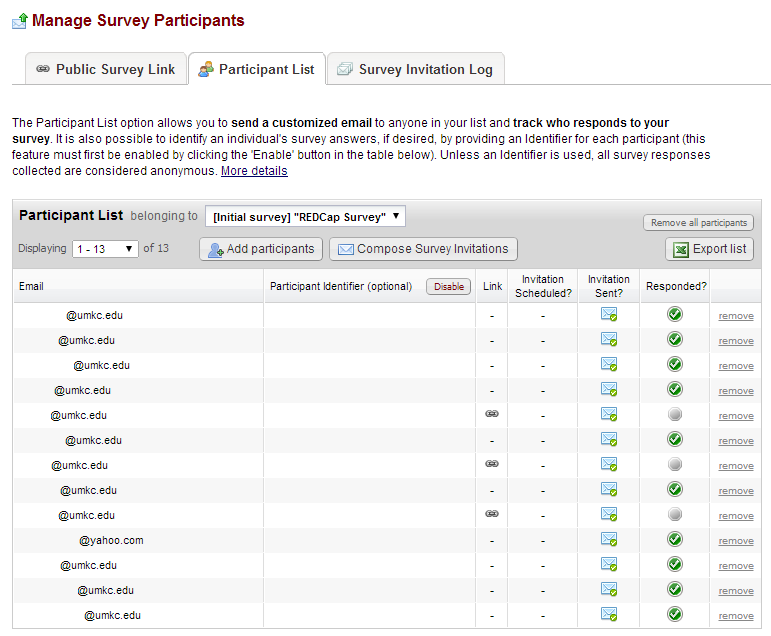
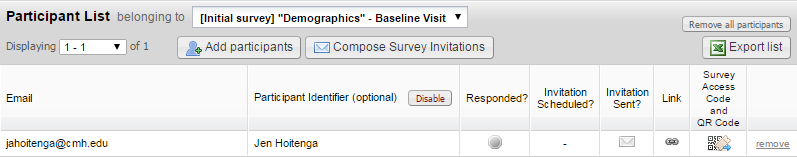
When you return to the Manage Survey Participants module (seen below), you will see the list of participants along with a sent/unsent status regarding the e-mail invitation, and a status checking whether or not the participant has responded. If Participant Identifiers are not enabled, there is no way to link an individual’s e-mail address to a particular record, maintaining survey anonymity. If needed, you can export the participant list as a .CSV file.
The Survey Invitation Log (not pictured) allows you to sort your participant list with various filters and view some finer details (such as the time at which a survey invitation was sent out to a participant). Individual times at which survey invitations should be sent out (if the invitation to a participant is not already sent) can be modified here.
[TIPS AND TRICKS]:
If you have a long list of e-mail addresses separated by some punctuation other than line breaks, using the “Replace” feature (Windows shortcut Ctrl-H) in a program such as Word will fix this formatting so you can paste the list into REDCap. For instance, if your e-mail addresses are separated by “; ” (semicolon space), in the Replace window of Microsoft Word, simply have the program find “; ” and replace with “^l” (carat lowercase-L).
If there is another e-mail address you would like to have the survey e-mails come from (besides the main e-mail address associated with your account), click the “From:” drop-down box in the “Compose Survey Invitations” window and add an additional e-mail address to your account. This e-mail address must be verified via verification e-mail.
If a survey contains study-qualifying data in a multiple-choice field, you may choose to end a survey prematurely when certain qualifications are (or are not) met by using the Stop Action icon in the Online Designer (the red stop sign). This will prevent you from gathering unnecessary data, and save time for the survey-taker. For instance, if your question is “What is your role at NJH?” and you want the survey to continue for everyone who isn’t a student, you may click the Stop Actions icon and select to stop the survey at that point for the “Student” response.
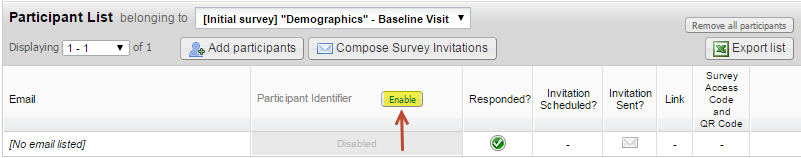
REDCap users can compile a list of participants, send invitations, track who has responded, and view a log of all invitations that have been sent.
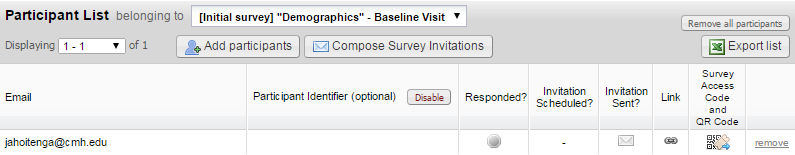
The Participant List option allows you to send a customized email to anyone in your list and track who responds to your survey. When you add a participant, you can also add a Participant Identifier. Unless an Identifier is used, all survey responses collected are considered anonymous. To use this feature, navigate to Manage Survey Participants and then click on the Participant List tab.
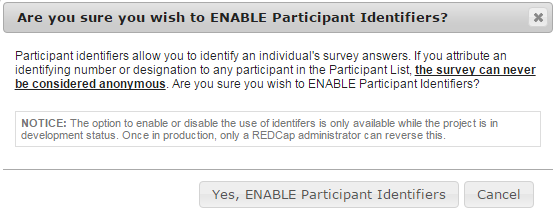
If you would like to use a Participant Identifier, you must Enable this before you add your participants. If you enable this feature, the survey is no longer considered anonymous. REDCap will alert you and ask you to confirm that you do want to enable the participant identifier.
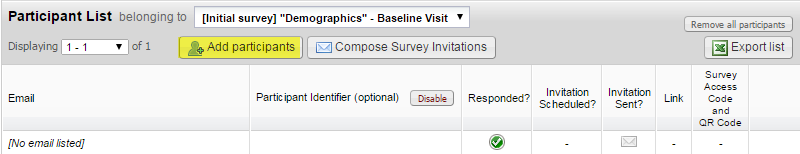
To add a participant, click on the Add Participant icon.
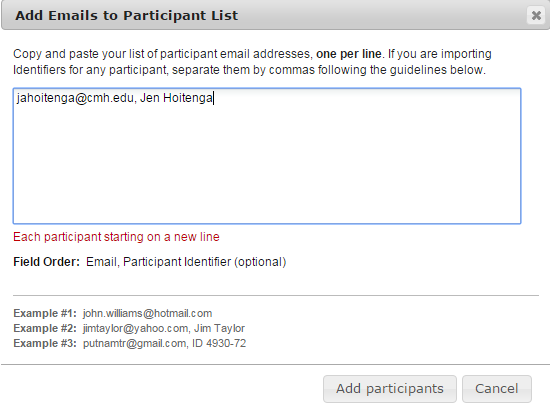
Enter the email address of the recipient and if you are using a Participant Identifier, enter a comma and then enter the participant’s name. If you are not using a Participant Identifier, enter each email on a separate line.
Example with Participant Identifier:
Example without Participant Identifier:
If a participant's email address needs to be changed after it has been added to the Participant List, click on the email address in the list to begin editing it. You may also remove a participant by clicking the remove link next to the participant’s name.
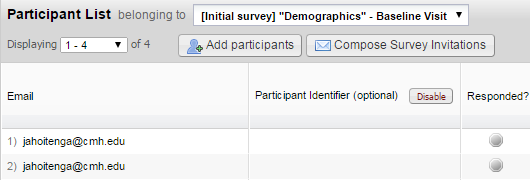
If the participant needs to take a survey more than once, you will need to add the participant the exact number of times they should take the survey. For an example, if you need every participant to take your survey twice, you will need to add them in the Participant List twice. Two invitations will then be sent to the participant, each with its own unique survey link.
Compose Survey Invitation
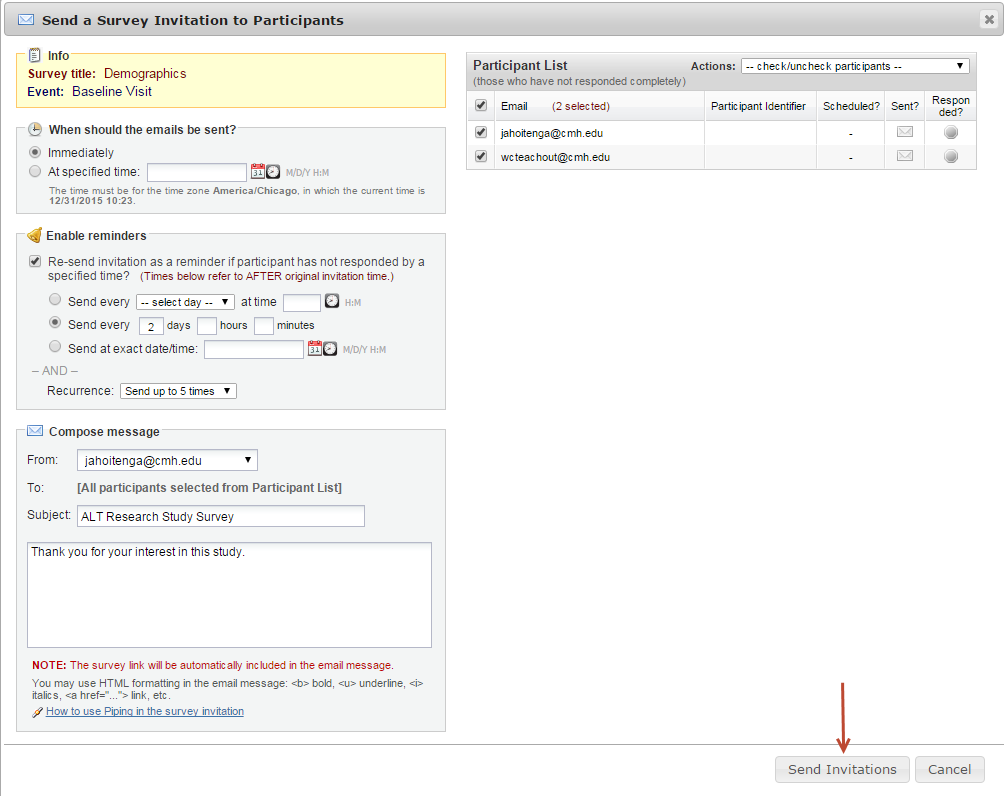
Once you have added all of your participants, you may compose a survey invitation by clicking on the “Compose Survey Invitations” icon and then enter the following criteria:
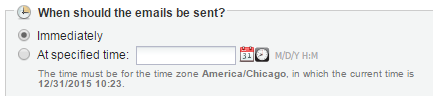
When should emails be sent: Select Immediately or specify a date and time.
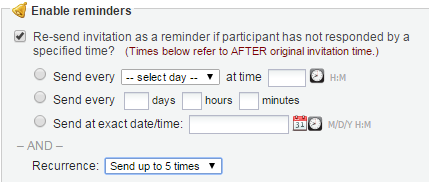
Enable Reminders: Check the box if you would like the survey invitation to be sent as a reminder if the participant hasn’t answered in a specific amount of time. You may specify to send the reminder every day, every weekday, on a specific day, every x amount of day, hours and/or minutes or send the reminders at a specific date and time. You will also need to specify how many reminders should be sent. The limit is 5.
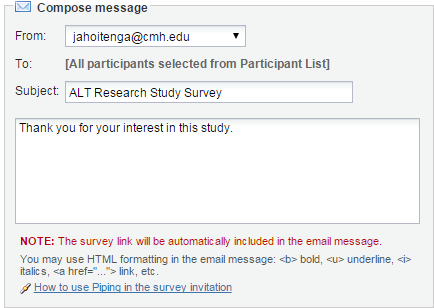
Compose Message:
From: Use the drop down and select an email address.
To: This will automatically be sent to the participants you have entered and selected.
Subject: Enter an optional subject
Message: Enter an optional message.
Note: you may use piping and/or HTML in your survey invitations!
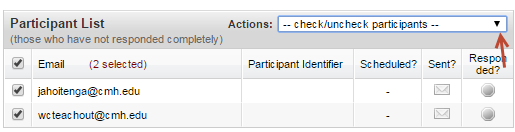
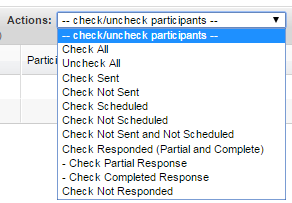
Participant List: Select which participants you want to send the invitation to. You may use the drop down under Actions and select participants who meet specific criteria such as “Check Not Responded."
When you are ready, click Send Invitations.
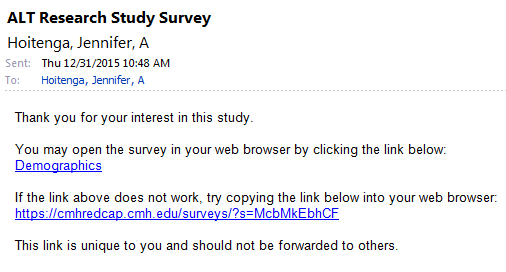
Example of a survey invitation email the recipient will receive:
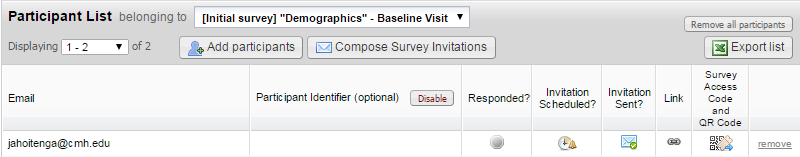
Once the survey is sent, the Participant List will show you if the participant has responded, if the invitation was scheduled, if the invitation was sent and the unique link to the survey invitation.
After receiving an email invitation and then completing the survey, the participant's response status in the list below will be changed to Responded  or Partial Response
  , otherwise their status will remain as No Reponse
  . Once a participant has responded, they will not be able to take the survey again unless you add them again as a participant.
Survey Invitation Log
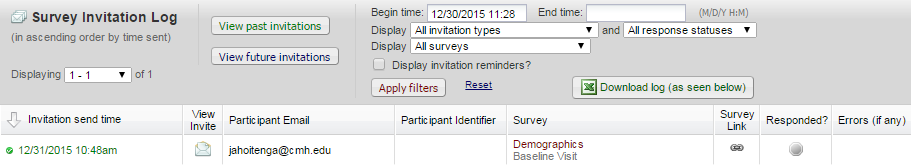
The Survey Invitation log displays the survey invitations that have already been sent or have been schedule to be sent to survey participants. To use this feature, navigate to Manage Survey Participants and then click on the Survey Invitation Log tab.
For each invitation, it displays the participant email, participant identifier (if exists), survey name and the date/time in which the invitation was or will be sent. You can also view the invitation email itself by clicking the icon in the “View Email” column.
The Survey Invitation log allows you to filter by specific dates, invitation types (sent invitations, scheduled invitations and failed invitations), response statuses (Unresponded, Partial Responses and Completed Responses) and survey names/events. You have the option to display invitation reminders and to view past or future invitations.
You may export the log by clicking the “Download Log” icon.
You can set up survey invitations to be sent automatically by using Automated Invitations. Instead of adding your survey participants through the Participant List, automated invitations can be scheduled to be sent automatically based upon specific conditions. To use this feature, you must first designate an email field to use for invitations to survey participants.
Designate an email field to use for invitations to survey participants
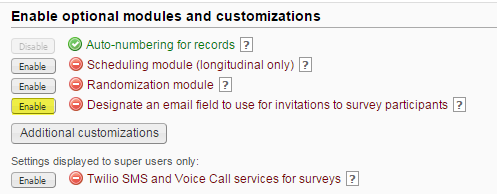
To designate an email field, navigate to Project Setup and click Enable next to “Designate an email field to use for invitations to survey participants.”
Choose an email field to use for your survey invitations and then click Save.
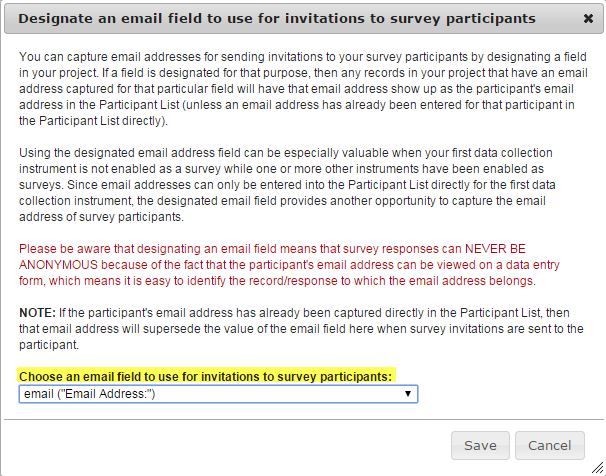
Note: If you enable this feature, your survey responses will not be anonymous since the participant’s email address can be viewed on the data collection form.
Automated Invitations
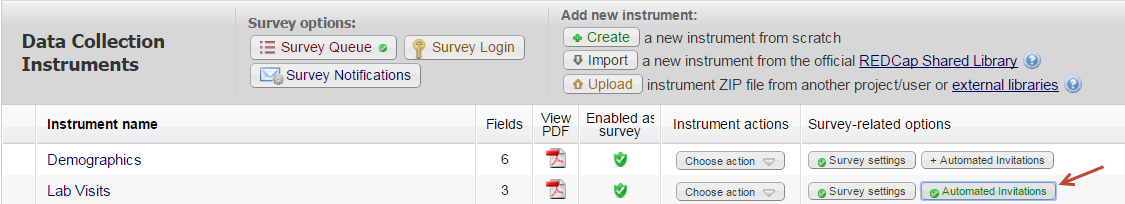
Navigate to Online Designer and click on the Automated Invitations icon.
Step 1: Compose Message
From: Use the drop down and select an email address.
To: This will automatically include all participants who meet your criteria
Subject: Enter an optional subject
Message: Enter an optional message
Note: you may use piping and/or HTML in your survey invitations!
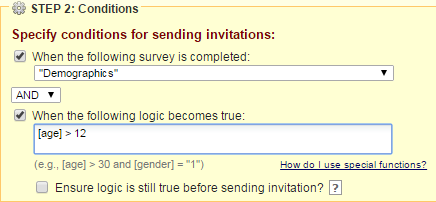
Step 2: Conditions—Specify the conditions for sending the invitations
You may select “When the following survey is completed” and then use the drop down and select a survey. If you would like to add additional logic as to when the next survey should be displayed, use the Boolean operator box and select AND/OR and then check the box next to “When the following logic becomes true” and add your logic in the text box. For example, you may want your second survey to start after your first survey is completed AND the participant’s age is greater than 12. To do this, I add the variable for the participant’s age field in square brackets and then the greater than sign and the number in quotations: [age] > 12
If you would like REDCap to check the logic in real time prior to sending the message, click the box next to “Ensure logic is still true before sending invitation”. REDCap will re-evaluate the logic against the record’s data values whenever the record values are changed AFTER the invitation has been scheduled but BEFORE it has been sent to the respondent. If the logic is no longer true, the invitation will not be sent.
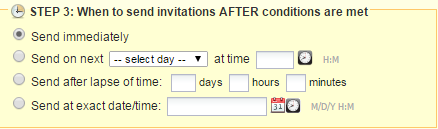
Step 3: When to send invitations AFTER conditions are met
Choose to send: immediately, on the next X day at X time, after X amount of days, hours and or minutes, or at an exact date/time.
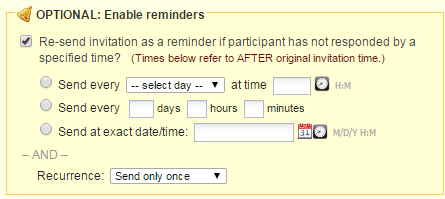
Optional: Enable Reminders
Check the box if you would like the survey invitation to be sent as a reminder if the participant hasn’t answered in a specific amount of time. You may specify to send the reminder every day, every weekday, on a specific day, every x amount of day, hours and/or minutes, or at a specific date and time. You will also need to specify how many reminders should be sent. The limit is 5.
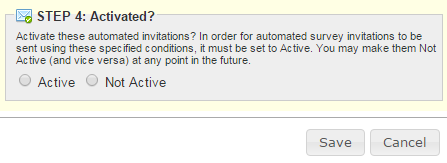
Step 4: Activate
Once you are ready, click Active and then click Save.
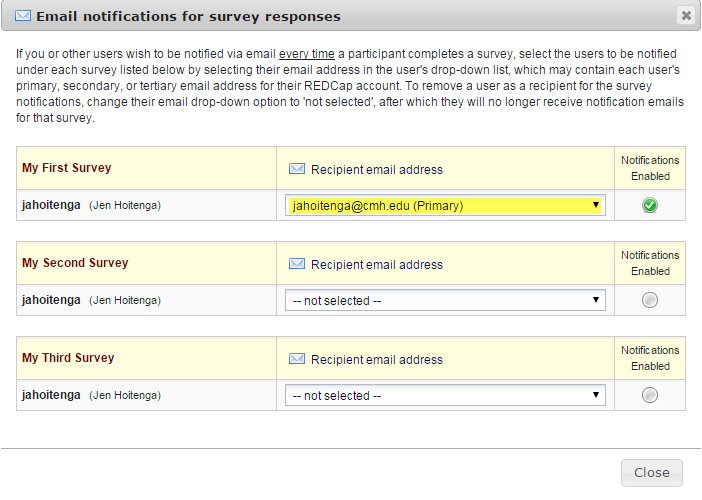
Survey notifications can be used if you or other users wish to be notified via email every time a participant completes a survey. Please note: The notification email message you receive from REDCap is hardcoded and cannot be changed.
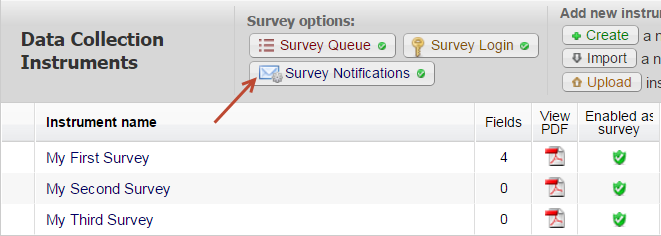
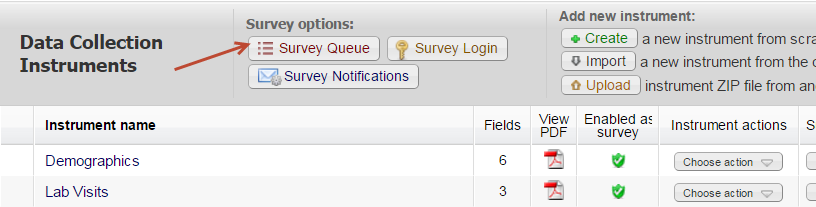
To activate Survey Notifications, navigate to Online Designer and click the Survey Notifications icon that is located above your data collection instruments.
Use the drop down underneath the “Recipient Email Address” column and select each user who would like to be notified for each specific survey. Once you have selected an email address, the Notifications Enabled icon will turn green.
If you would like to remove a user as a recipient for the survey notifications, change their email drop-down option to 'not selected', after which they will no longer receive notification emails for that survey.
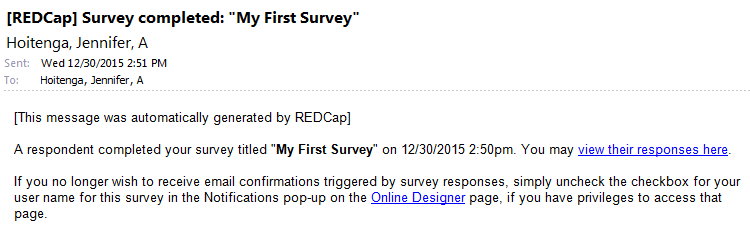
Example of a survey notification email:
The survey queue allows you to manage what order consecutive surveys are completed by participants, and to add logic if a survey will only be filled out when certain conditions are met. The queue can act as a to-do list, informing the participant which surveys have been completed and which is left to take. You can also enable auto-continue to where a participant goes directly to the next survey without seeing the survey queue list.
To activate your survey queue, navigate to Online Designer and click the Survey Queue icon located above your data collection instruments.
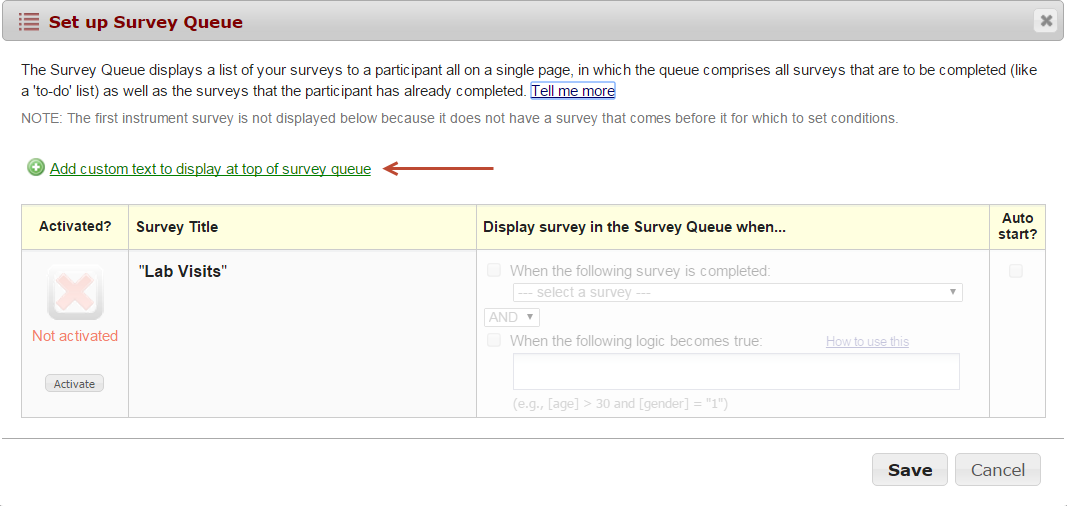
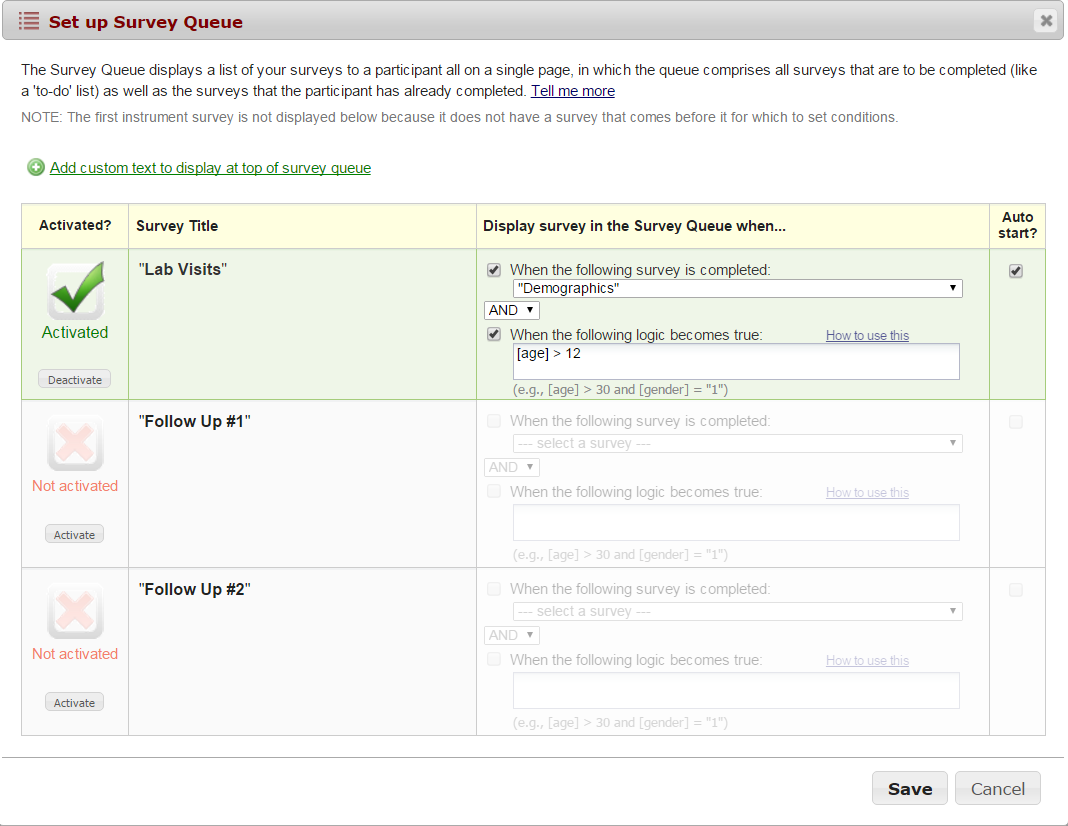
A “Set up Survey Queue” box will appear. If you would like, you may add your own custom text to display at the top of the survey queue.
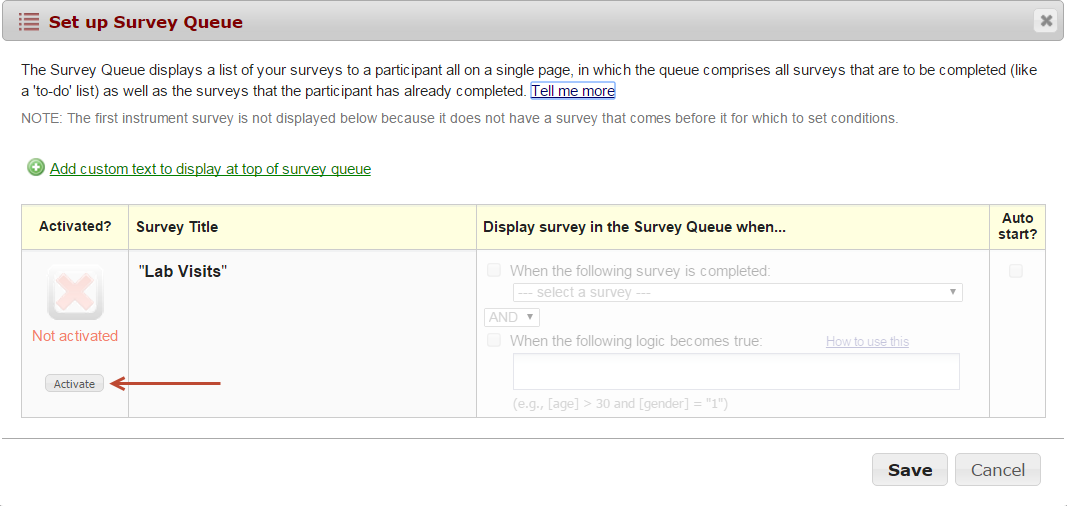
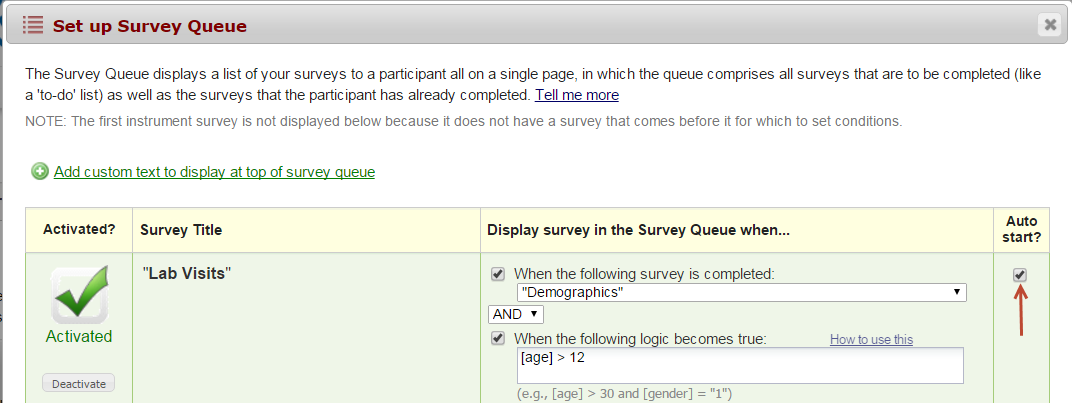
Click the Activate icon for each survey you would like to set up. Under the “Display survey in the Survey Queue when…” column, use the drop down to indicate when the survey should be displayed. For example, you might want your second survey to display after the first survey is completed.
If you would like to add additional logic as to when the next survey should be displayed, use the operator drop down and select AND/OR and then check the box next to “When the following logic becomes true” and finally add your logic in the formula box. For an example, I want my second survey to start after my first survey is completed AND the participant’s age is greater than 12. To do this, I added the variable for the participant’s age field in square brackets, the greater than sign and the number. [age] > 12
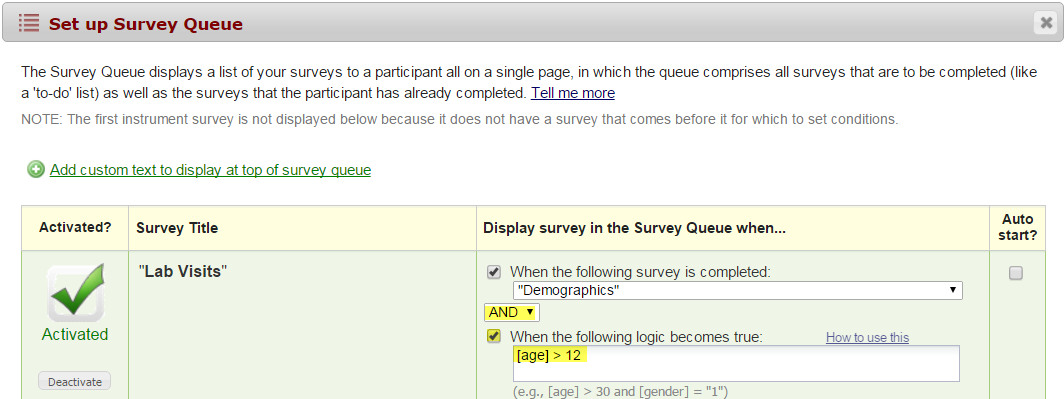
When a participant takes my survey and enters an age greater than 12, they will see the following Survey Queue:
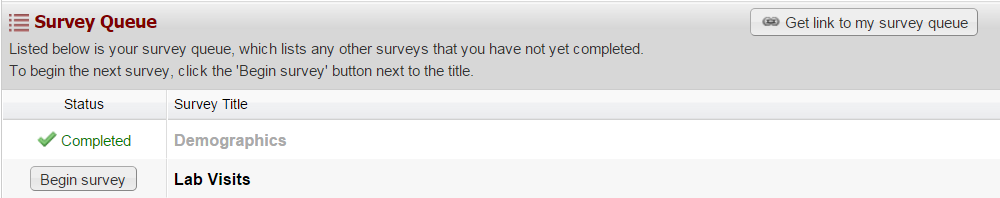
They can click the Begin Survey to start the second survey. If you would like the second survey to automatically launch and do not want to force the participant to click the Begin Survey icon, you can accomplish this by going back to the Survey Queue settings and click the box underneath the Auto Start column. When the participant finishes the first survey and they are at least 13 years old, the second survey will automatically display after the first is submitted.
You may continue to add logic for the rest of your surveys.
[TIP]:
It is important to test your survey queue prior to your project being moved into production! Take your survey a couple of times to ensure the survey queue logic is working.
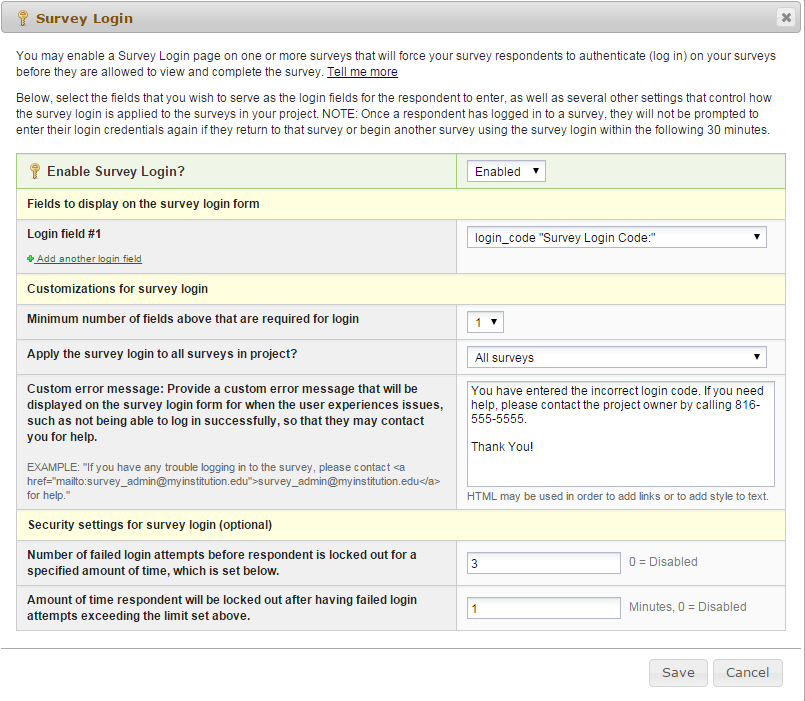
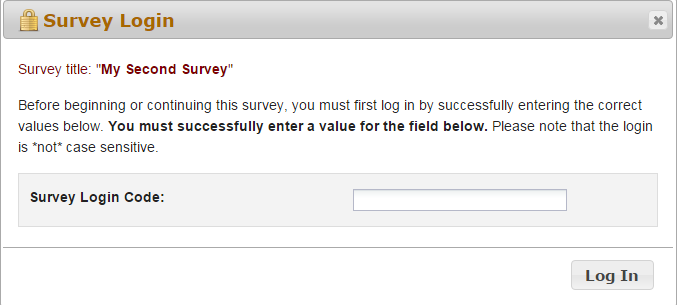
You may enable a Survey Login page on one or more surveys that will force your survey respondents to authenticate (login) on your surveys before they are allowed to view and complete the survey. You have the ability to select up to three fields from your project to use as the Login Fields. These values must already be stored on the respondent’s record in the project.
To activate the Survey Login, navigate to Online Designer and click the Survey Login icon that is above your data collection instruments. The Survey Login settings box will appear. Use the drop down and select Enabled.
Login Field # 1: Use the drop down and select a field from your project. If you would like to add another login field, click the Add another login field link.
Minimum number of fields above that are required for login: If you have more than one field that you are using as the login, indicate how many of the fields are required. For example, you might have three fields but only two of them are required to be answered in order to login.
Apply the survey login to all surveys in this project: Use the drop down and indicate if the survey login should be used for all surveys or if you would like to specify the surveys this will be used for. If you would like to specify which surveys this will be used for, you will need to navigate to survey settings.
Custom error message: Enter a custom error message that will be displayed if the user experiences difficulty logging in.
Number of failed login attempts: Enter the amount of login attempts you would like to grant to the participant. If you would like them to have unlimited attempts, enter 0.
Amount of time respondent will be locked out: Enter the amount of time (in minutes) you would like to have the participant locked out for. If you do not wish to lock them out, enter 0.
When the participant attempts to take the survey, this will receive this login box:
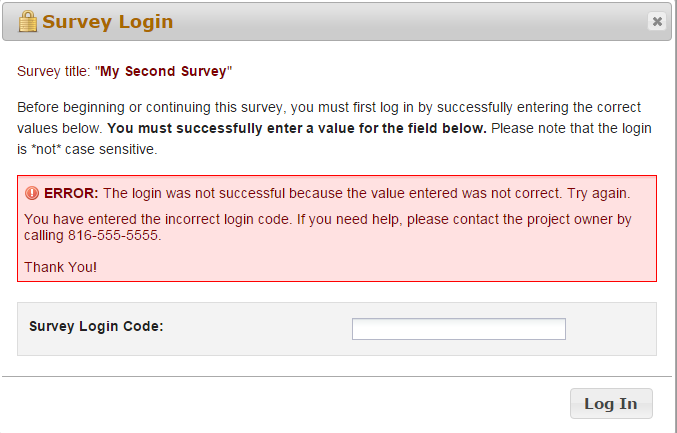
If they do not enter the correct Login Code, they will receive this message:
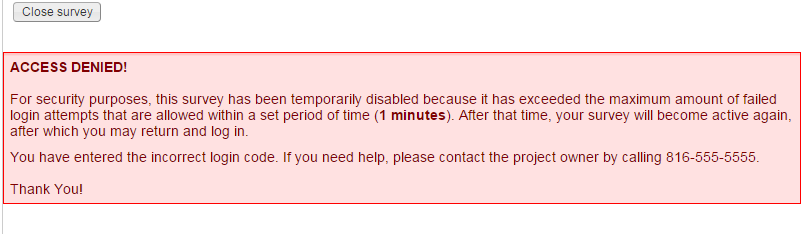
If they reach the maximum number of failed attempts you specified, they will receive this message:
Data Access
Assigning User Rights in a project enables you to determine who has access to your project and their level of data access. In order for a person to be added to your project, they must complete NJH REDCap training.
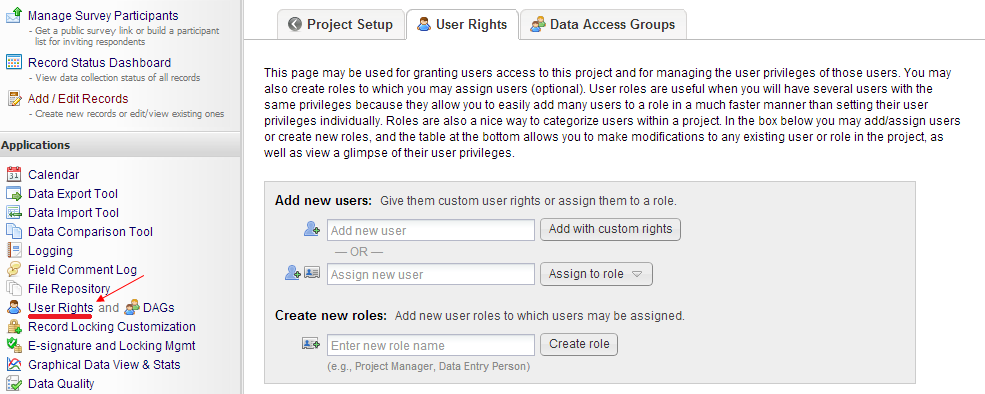
Assigning User RightsAdd users to your project by clicking on User Rights on the left-side toolbar. Start entering the user’s name or username in the “Add new user” box and then click on “Add with custom rights.”
Next, check/uncheck the Basic and Data Entry rights for the user and then click “Add user.”
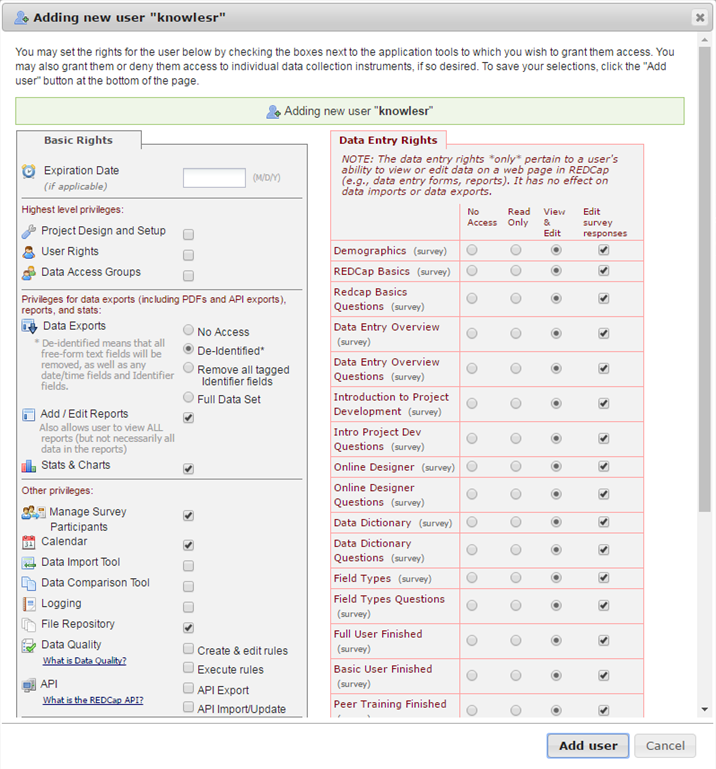
[TIPS AND TRICKS]: For multi-site studies, use Data Access Groups (DAG) to limit a user’s access to only their site’s records.
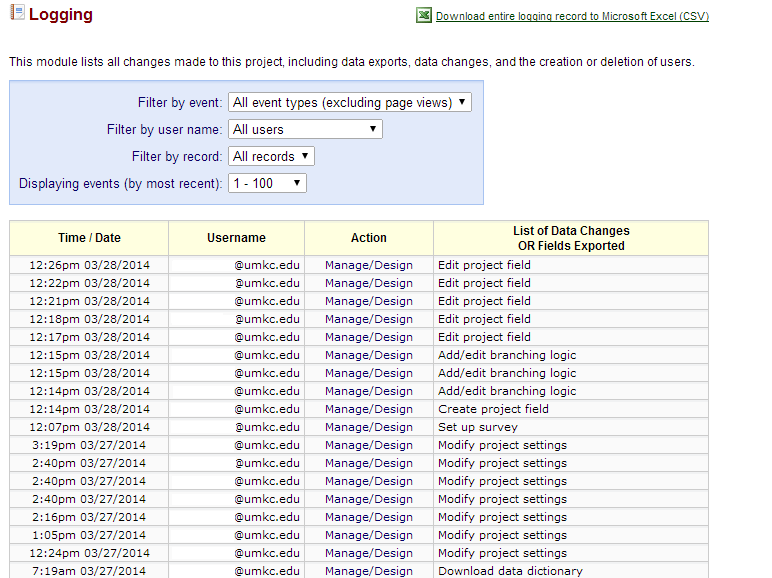
By clicking the “Logging” tool in the left-side toolbar, you can view the entire audit trail throughout the life of the project. Each event’s category and specific change is listed along with the time/date and user’s username. The logging box is easily filterable, and can even be downloaded to a singular CSV file if need be.
In the Report Builder application accessible from the left-side toolbar, you may view the results of a specific field or fields for all records in your project. The purpose of various reports can be to isolate records, identify groups, study certain demographics of your participant population, and more. Let’s say I want to produce a general demographic report of my participants along with their resting heart rate and BMI. To generate a new report, click the “Report Builder” tool in your left-side menu.
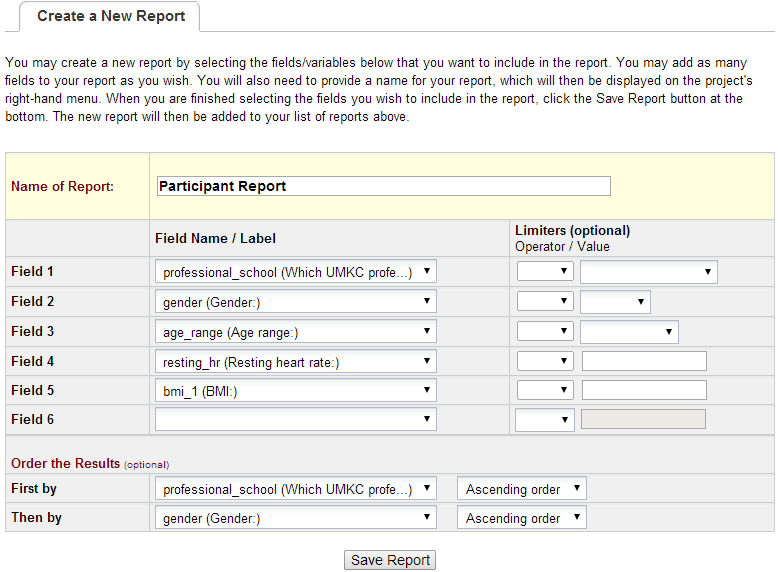
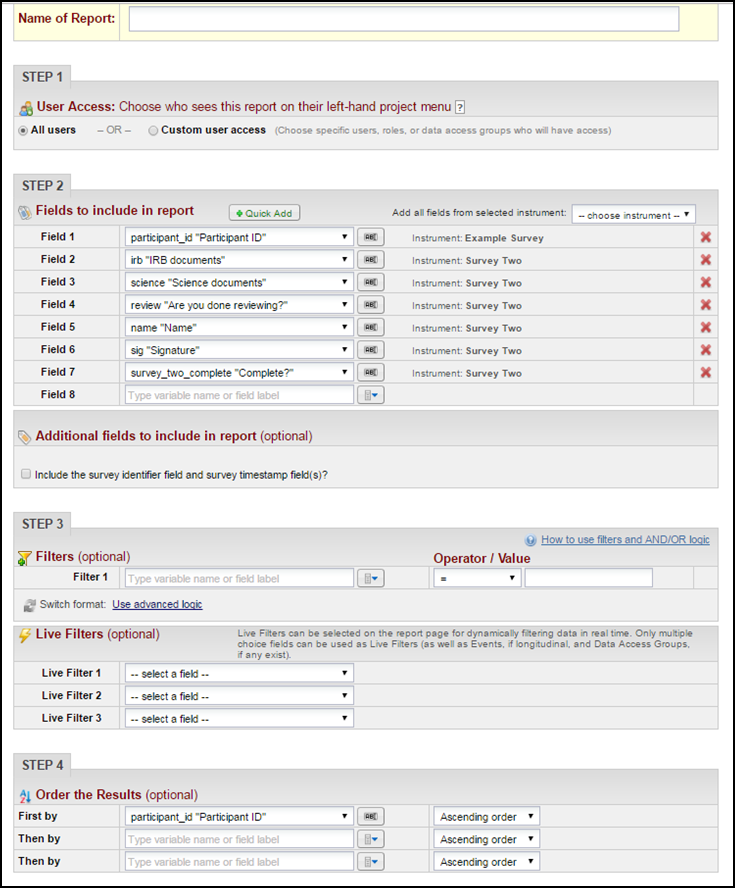
Name your report, and specify the variables you would like to the report to display. You may choose to order the results in a specific manner to make data viewing easier. In this example, I have sorted by professional school, and then within the groups of professional schools, I have sorted by gender. Once you are finished organizing the details, click “Save Report.”
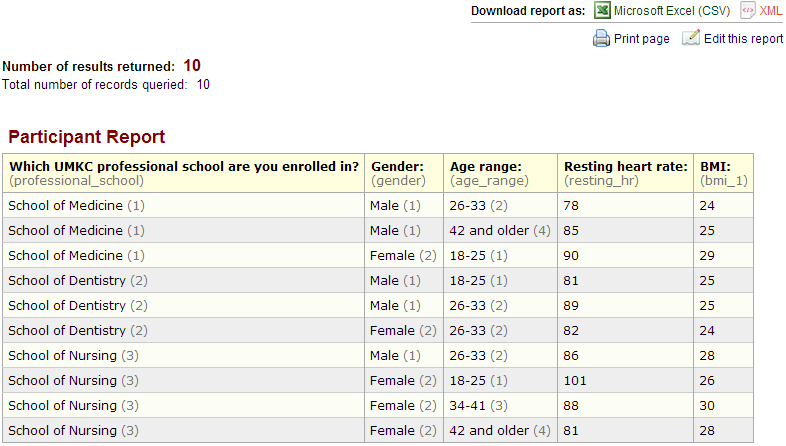
Clicking “View” next to the title of your report after you have saved it will present the current data report (see below). This is updated in real time as your data is collected. You may export your reports to .CSV or .XML format; you may also simply print your report.
NOTE: Please notice the number in parentheses next to certain variable names below. This number represents the encoded value of each multiple-choice variable option, and does NOT represent the number of records with that result.
Let’s say we only want to view records for those enrolled in the UMKC School of Nursing. To do this, we will utilize the “Limiters” in the initial “Create a New Report” page.
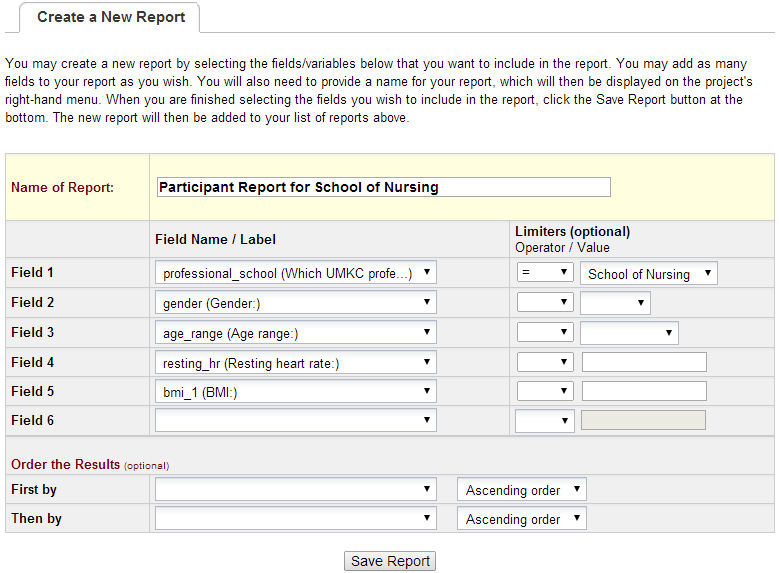
You will notice that this time, I have specifically indicated that I want to see only the records where [professional school] = School of Nursing. Below is the result when viewing the report:
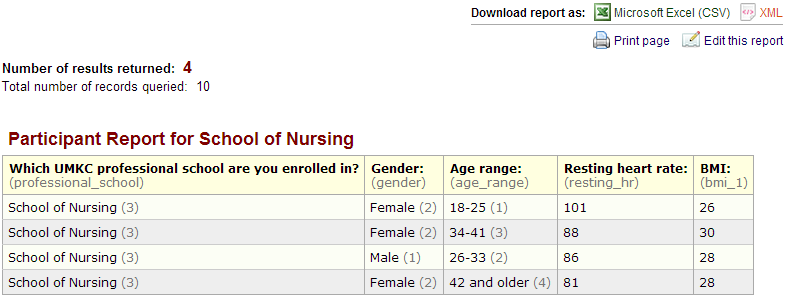
Notice that although 10 total records were queried, only 4 records matched our conditions, and thus only 4 are shown.
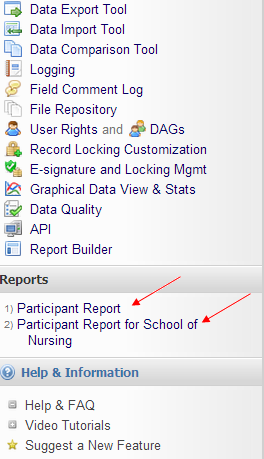
You may have multiple reports that you would like to generate for your project. This is easily tracked through REDCap. Each report is even given its own shortcut in the Reports Module (which will appear once you have created your first report).
[TIPS AND TRICKS]:
In the Report Builder, filtering/sorting by fields is easiest for fields that are single-answer multiple choice (drop-down, radio buttons, true/false, yes/no).
Each report changes in real time as new data records (or surveys) are created for the project. Once more records are completed, you can go back to the same report and it will update accordingly.
If you are conducting a study for which you already have some partial data, or if you are simply importing data from an additional source, using the Data Import Tool is one of the easiest ways to accomplish this task. First, you will be prompted to download one of two .CSV templates: one arranging separate records into rows, and another into columns. Whichever you choose may depend on how your other data is already arranged, and/or whichever you aesthetically prefer.
Once you have downloaded the template, use a program (generally Excel) to fill in the records, ensuring that the correct variables are slotted into the correct places. Then, on the same Data Import application page, you may re-upload the .CSV file and import your new data records.
NOTE: This section deals with importing data records into your project. For more information on importing your data dictionary (i.e. your data forms), see the Data Dictionary section.
[TIPS AND TRICKS]: For ease of data transfer, ensure that the order of the variables is the same on both your external source and your REDCap data forms.
Click here for more information on migrating a project from Excel to REDCap.You can export data by using the Data Exports, Reports, and Stats application.
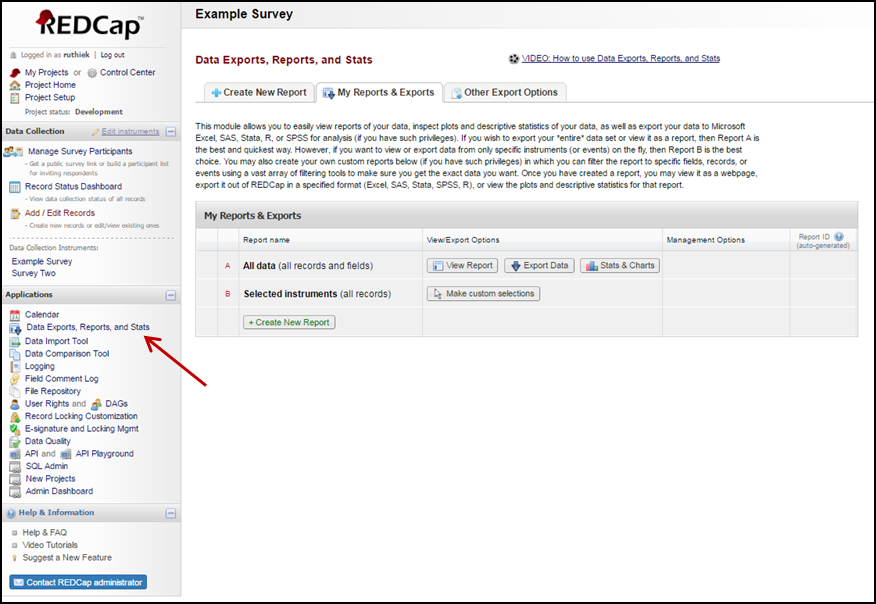
This module allows you to easily view reports of your data, inspect plots and descriptive statistics of your data, as well as export your data to Microsoft Excel, SAS, Stata, R, or SPSS for analysis (if you have such privileges). If you wish to export your *entire* data set or view it as a report, then Report A is the best and quickest way.
However, if you want to view or export data from only specific instruments (or events) on the fly, then Report B is the best choice.
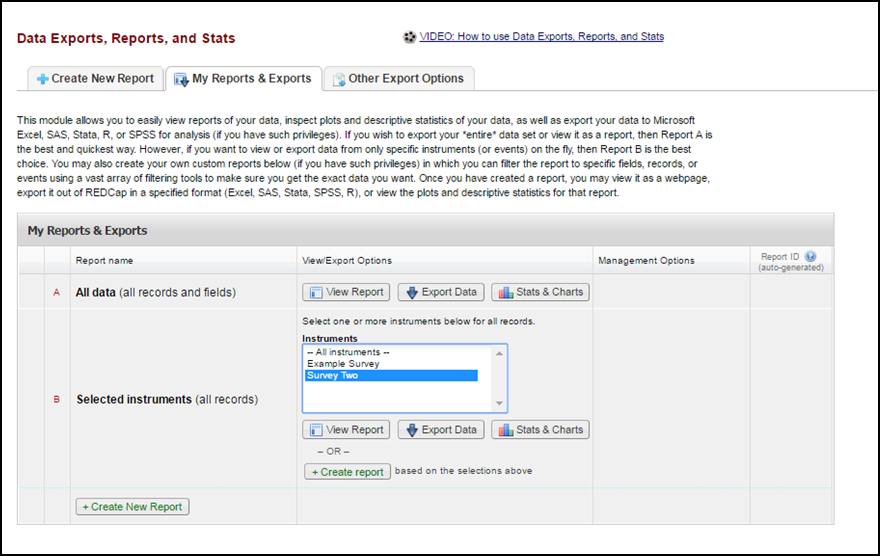
You may also create your own custom reports below (if you have such privileges) in which you can filter the report to specific fields, records, or events using a vast array of filtering tools to make sure you get the exact data you want.
Once you have created a report, you may view it as a webpage, export it out of REDCap in a specified format, or view the plots and descriptive statistics for that report. The Data Export Tool is compatible with many analysis programs: Excel, SPSS, SAS, R, and Stata.
An entire REDCap project can now be exported as a single XML file (which happens to be in CDISC ODM format). The file includes events, arms, instruments, fields, project attributes, and descriptive field attachments. If the project contains data, then users can also optionally export the project data (including uploaded files) in the same XML file. This file can serve as a snapshot or backup copy of the project.
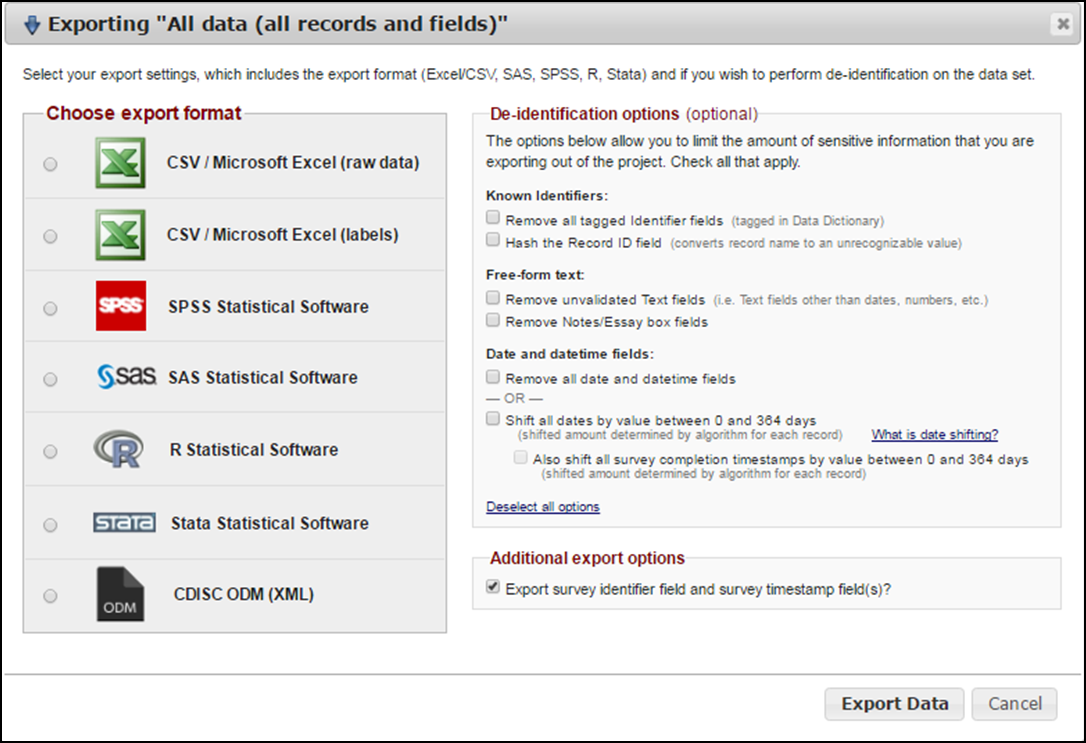
[TIPS AND TRICKS]: Exporting data to programs other than Excel produce syntax files, which are not always the easiest to deal with. Alternatively you can export to .CSV and then import the .CSV file in to your preferred statistical analysis program. If you choose this option, to ensure you are getting the data precisely the way you want it, be sure to download one of the .CSV files listed next to “Excel” rather than the one listed next to your program of choice.
Image Maps
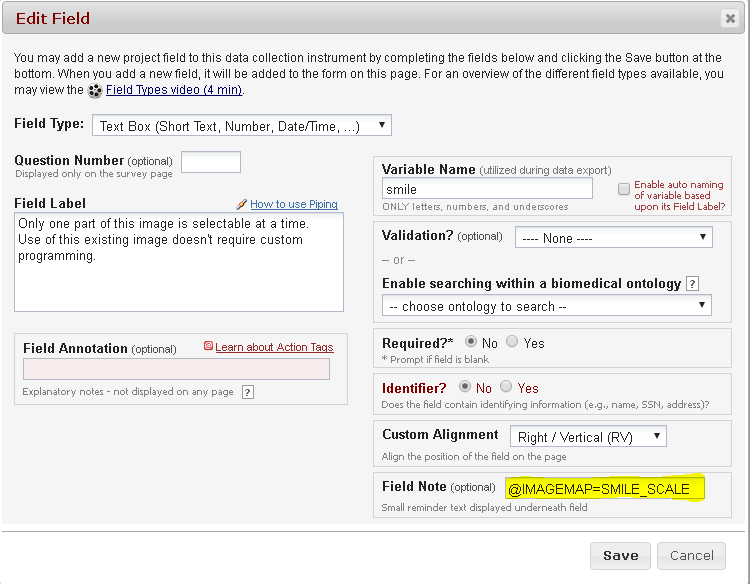
The Smile Scale only allows one item to be selected at a time. Example of a smile scale displayed in a survey or form with number 4 selected:
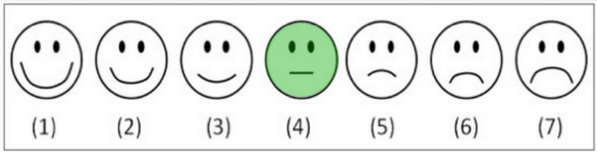
To add the Smile Scale to your project, choose 'Text Box' field type and add @IMAGEMAP=SMILE_SCALE to the Field Note. The data will be saved as a number 1 - 7. The image won't show up in 'Preview' mode or in PDF reports.
Body Map images allow multiple selections on a female or male body. The data will be saved as a comma-delimited list of text.
Example data for selected female areas:
b01,b02,b12,b22,b25,f15,f20,f23,f36
Example female body map image displayed in survey or form:
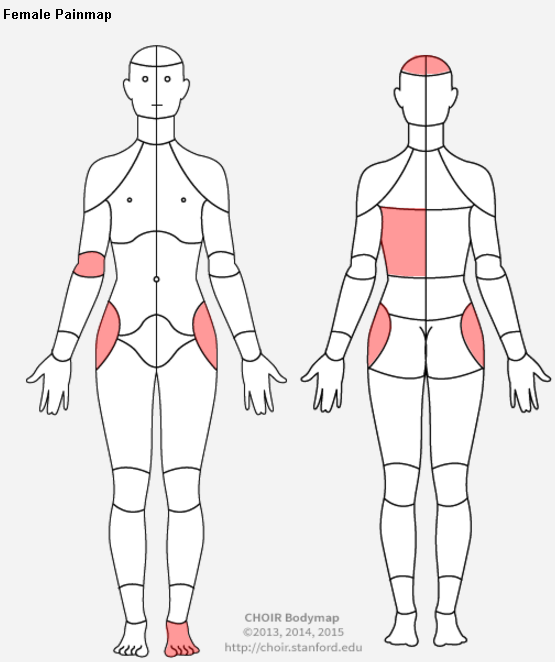
To add the Female Body Map to your project, choose 'Text Box' field type and add @IMAGEMAP=PAINMAP_FEMALE to the Field Note as shown below. The image won't show up in 'Preview' mode or in PDF reports.

Example male body map image displayed in survey or form:
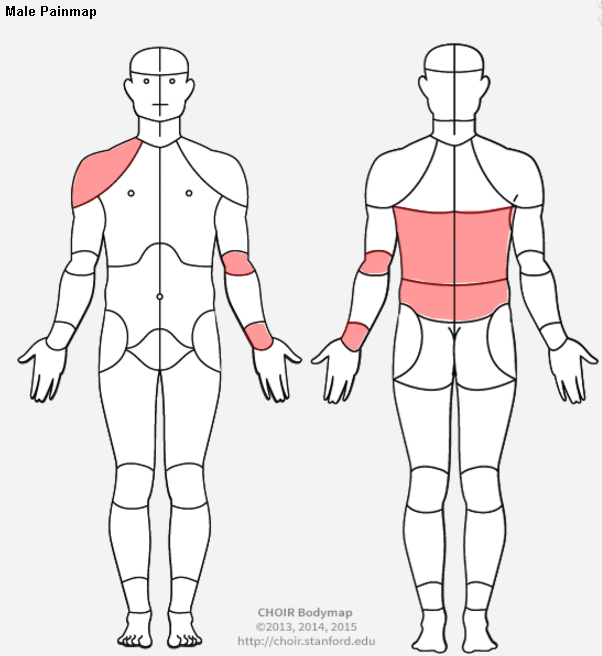
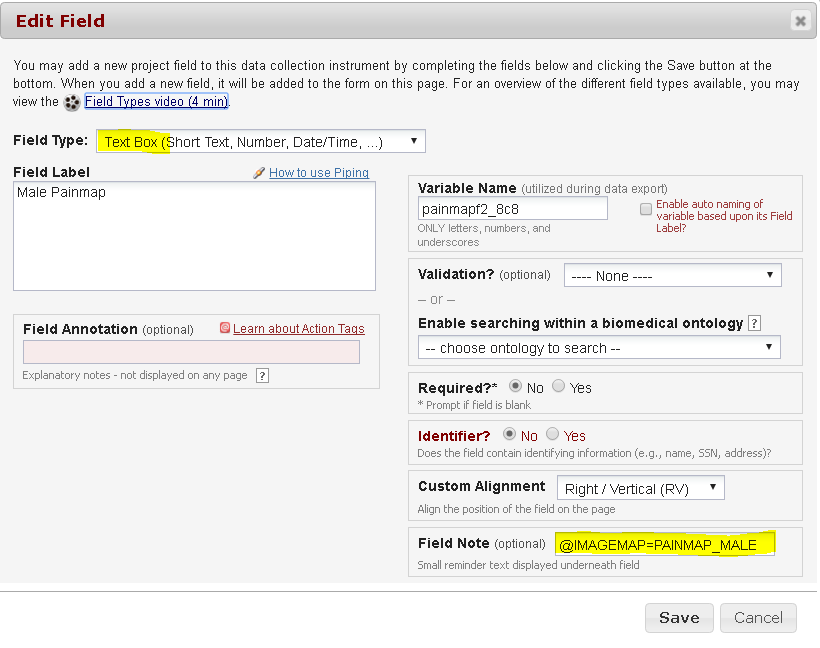
To add the Male Body Map to your project, choose 'Text Box' field type and add @IMAGEMAP=PAINMAP_MALE to the Field Note as shown below. The image won't show up in 'Preview' mode or in PDF reports.
This requires customization for your project by Research Informatics Services. We would be happy to give you a quote – just contact Pearlanne Zelarney, Director of Research Informatics Services
Miscellaneous
To retain all the special characters in your REDCap project:
When you download a data dictionary file from REDCap, it comes out encoded as UTF-8, which is correct if you want the special characters to display correctly. As soon as you open it in Excel and save it, Excel automatically changes the encoding back to ANSI. When you upload that dictionary back into REDCap you see jumbled characters.
There are three solutions to this problem:
-
Downloading this addin to Excel: http://jaimonmathew.wordpress.com/2011/08/23/excel_addin_to_work_with_unicode_csv/
- When saving a data dictionary with special characters, just click the “Unicode CSV” tab and click Save, instead of saving it regularly. Upload this saved dictionary to REDCap.
- When saving the data dictionary, choose Save As and save as a CSV UTF-8 (Comma delimited) (*.csv) file type.
- Save the data dictionary in Excel, then open it in Notepad or Notepad++, and then click save as to change the encoding to UTF-8.